

How to add animation effects in ECharts


ECharts is an open source visualization chart library based on JavaScript. It provides a rich range of chart types and interactive functions and is widely used in the field of data visualization. Compared with static charts, dynamic charts are more vivid and intuitive and can better show changes and trends in data. Therefore, adding animation effects in ECharts can enhance the attractiveness and readability of charts, while also being more in line with the aesthetic needs of modern users.
This article will introduce how to add animation effects in ECharts and provide specific code examples for reference.
- First of all, to enable animation effects in ECharts, you need to set animation to true or specific animation configuration items in the echarts.init() method, for example:
var myChart = echarts.init(document.getElementById('main'), null, {animation: true});
//或者
var option = {
    animation: {
        duration: 2000, //动画持续时间,单位为毫秒
        easing: 'elasticOut' //缓动函数类型
    },
    //其他配置项...
};
var myChart = echarts.init(document.getElementById('main'), null, option);- Next, you need to set animation-related parameters in the data and chart configuration items, for example:
option = {
    xAxis: {
        type: 'category',
        data: ['Mon', 'Tue', 'Wed', 'Thu', 'Fri', 'Sat', 'Sun'],
        animation: true, //启用x轴的动画效果
        axisLabel: {
            interval: 0
        }
    },
    yAxis: {
        type: 'value',
        animation: {
            duration: 2000, //y轴的动画持续时间,单位为毫秒
            easing: 'bounceOut' //缓动函数类型
        }
    },
    series: [{
        name: 'sales',
        type: 'bar',
        data: [120, 200, 150, 80, 70, 110, 130],
        animationDelay: function (idx) { //启用条形图的动画效果
            return idx * 500;
        }
    }]
};- Finally, you need to call the myChart.setOption(option) method in the JavaScript code , apply the chart configuration items to the chart and enable animation effects.
myChart.setOption(option);
- In addition to the above basic animation configuration items, ECharts also provides a rich animation effect extension library, such as echarts-effect, echarts-gl and echarts-animation, etc. Use these extension libraries More complex and fantastic animation effects can be achieved.
The following is a complete ECharts animation sample code:
var myChart = echarts.init(document.getElementById('main'), null, {animation: true});

var option = {
    xAxis: {
        type: 'category',
        data: ['Mon', 'Tue', 'Wed', 'Thu', 'Fri', 'Sat', 'Sun'],
        animation: true,
        axisLabel: {
            interval: 0
        }
    },
    yAxis: {
        type: 'value',
        animation: {
            duration: 2000,
            easing: 'bounceOut'
        }
    },
    series: [{
        name: 'sales',
        type: 'bar',
        data: [120, 200, 150, 80, 70, 110, 130],
        animationDelay: function (idx) {
            return idx * 500;
        }
    }]
};

myChart.setOption(option);Through the above example, we can easily add various animation effects in ECharts and turn the data visualization chart into More vivid and easier to understand. At the same time, we also need to pay attention to the rationality and practicality of animation effects to avoid being overly cool and affecting the user experience.
The above is the detailed content of How to add animation effects in ECharts. For more information, please follow other related articles on the PHP Chinese website!

Hot AI Tools

Undresser.AI Undress
AI-powered app for creating realistic nude photos

AI Clothes Remover
Online AI tool for removing clothes from photos.

Undress AI Tool
Undress images for free

Clothoff.io
AI clothes remover

Video Face Swap
Swap faces in any video effortlessly with our completely free AI face swap tool!

Hot Article
Hot Tools

Notepad++7.3.1
Easy-to-use and free code editor

SublimeText3 Chinese version
Chinese version, very easy to use

Zend Studio 13.0.1
Powerful PHP integrated development environment

Dreamweaver CS6
Visual web development tools

SublimeText3 Mac version
God-level code editing software (SublimeText3)
Hot Topics
 1387
1387
 52
52

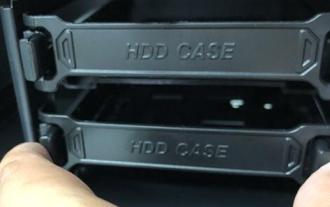 Tutorial on adding a new hard drive in win11
Jan 05, 2024 am 09:39 AM
Tutorial on adding a new hard drive in win11
Jan 05, 2024 am 09:39 AM
When buying a computer, we may not necessarily choose a large hard drive. At this time, if we want to add a new hard drive to win11, we can first install the new hard drive we purchased, and then add partitions to the computer. Tutorial on adding a new hard drive in win11: 1. First, we disassemble the host and find the slot of the hard drive. 2. After finding it, we first connect the "data cable", which usually has a fool-proof design. If it cannot be inserted, just reverse the direction. 3. Then insert the new hard drive into the hard drive slot. 4. After inserting, connect the other end of the data cable to the computer's motherboard. 5. After the installation is completed, you can put it back into the host and turn it on. 6. After booting, we right-click "This Computer" and open "Computer Management" 7. After opening, click "Disk Management" in the lower left corner 8. Then on the right you can
 How to add a TV to Mijia
Mar 25, 2024 pm 05:00 PM
How to add a TV to Mijia
Mar 25, 2024 pm 05:00 PM
Many users are increasingly favoring the electronic ecosystem of Xiaomi smart home interconnection in modern life. After connecting to the Mijia APP, you can easily control the connected devices with your mobile phone. However, many users still don’t know how to add Mijia to their homes. app, then this tutorial guide will bring you the specific connection methods and steps, hoping to help everyone in need. 1. After downloading Mijia APP, create or log in to Xiaomi account. 2. Adding method: After the new device is powered on, bring the phone close to the device and turn on the Xiaomi TV. Under normal circumstances, a connection prompt will pop up. Select "OK" to enter the device connection process. If no prompt pops up, you can also add the device manually. The method is: after entering the smart home APP, click the 1st button on the lower left
 How to use php interface and ECharts to generate visual statistical charts
Dec 18, 2023 am 11:39 AM
How to use php interface and ECharts to generate visual statistical charts
Dec 18, 2023 am 11:39 AM
In today's context where data visualization is becoming more and more important, many developers hope to use various tools to quickly generate various charts and reports so that they can better display data and help decision-makers make quick judgments. In this context, using the Php interface and ECharts library can help many developers quickly generate visual statistical charts. This article will introduce in detail how to use the Php interface and ECharts library to generate visual statistical charts. In the specific implementation, we will use MySQL
 Tutorial to quickly create desktop shortcuts in Win11
Dec 27, 2023 pm 04:29 PM
Tutorial to quickly create desktop shortcuts in Win11
Dec 27, 2023 pm 04:29 PM
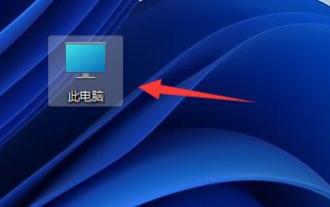
In win11, we can quickly start software or files on the desktop by adding desktop shortcuts, and we only need to right-click the required files to operate. Add a desktop shortcut in win11: 1. Open "This PC" and find the file or software you want to add a desktop shortcut to. 2. After finding it, right-click to select it and click "Show more options" 3. Then select "Send to" - "Desktop Shortcut" 4. After the operation is completed, you can find the shortcut on the desktop.
 Steps to draw dashboard using ECharts and Python interface
Dec 18, 2023 am 08:40 AM
Steps to draw dashboard using ECharts and Python interface
Dec 18, 2023 am 08:40 AM
The steps to draw a dashboard using ECharts and Python interface require specific code examples. Summary: ECharts is an excellent data visualization tool that can easily perform data processing and graphics drawing through the Python interface. This article will introduce the specific steps to draw a dashboard using ECharts and Python interface, and provide sample code. Keywords: ECharts, Python interface, dashboard, data visualization Introduction Dashboard is a commonly used form of data visualization, which uses
 How to add a new script in Tampermonkey-How to delete a script in Tampermonkey
Mar 18, 2024 pm 12:10 PM
How to add a new script in Tampermonkey-How to delete a script in Tampermonkey
Mar 18, 2024 pm 12:10 PM
Tampermonkey Chrome extension is a user script management plug-in that improves user efficiency and browsing experience through scripts. So how does Tampermonkey add new scripts? How to delete the script? Let the editor give you the answer below! How to add a new script to Tampermonkey: 1. Take GreasyFork as an example. Open the GreasyFork web page and enter the script you want to follow. The editor here chooses one-click offline download. 2. Select a script. , after entering the script page, you can see the button to install this script. 3. Click to install this script to come to the installation interface. Just click here to install. 4. We can see the installed one-click in the installation script.
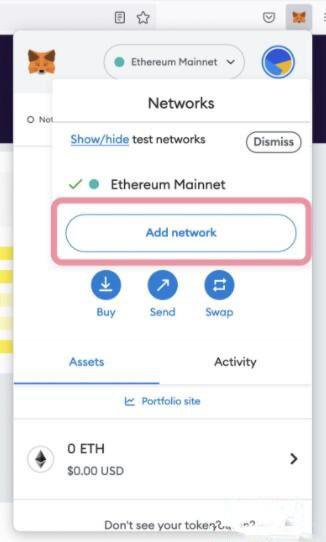 How to connect to Polygon network in MetaMask wallet? Tutorial guide for connecting MetaMask wallet to Polygon network
Jan 19, 2024 pm 04:36 PM
How to connect to Polygon network in MetaMask wallet? Tutorial guide for connecting MetaMask wallet to Polygon network
Jan 19, 2024 pm 04:36 PM
How to add a PolygonMainnet network To use MATIC (Polygon) with Metamask, you need to add a private network called "PolygonMainnet". Transferring in with the wrong network address can cause problems, so be sure to use the "PolygonMainnet" network before transferring out of $MATIC. The Metamask wallet is connected to the Ethereum mainnet by default, but we can simply add "PolygonMainnet" and use $MATIC. Just a few simple copy and paste steps and you're done. First, in the Metamask wallet, click on the network option in the upper right corner and select "C
 How to use map heat map to display city heat in ECharts
Dec 18, 2023 pm 04:00 PM
How to use map heat map to display city heat in ECharts
Dec 18, 2023 pm 04:00 PM
How to use a map heat map to display city heat in ECharts ECharts is a powerful visual chart library that provides various chart types for developers to use, including map heat maps. Map heat maps can be used to show the popularity of cities or regions, helping us quickly understand the popularity or density of different places. This article will introduce how to use the map heat map in ECharts to display city heat, and provide code examples for reference. First, we need a map file containing geographic information, EC
