Error.stack support has been newly added in IE10, which can speed up developers' script debugging and error correction. Especially some errors that are difficult to reproduce, such as asynchronous operations. The following content comes from the Microsoft IE team, which describes this feature in great detail.
Debugging applicationsStructured error handling in JavaScript relies on throw and try/catch, where the developer will declare an error and pass control flow to a part of the program that handles the error. When an error is raised, Chakra, the JavaScript engine in Internet Explorer, captures the chain of calls that caused the error, a process also known as a call stack. If the object being thrown is a Error (or a function whose prototype chain leads to Error), then Chakra will create a stack trace, a human-readable list of the call stack. The list will be represented as a property, a Error in the stack object. stack Contains the error message, function name, and source file location information for the function. This information will help developers understand the functions being called and even view the erroneous lines of code to quickly diagnose the flaw. For example, the information might indicate that one of the parameters passed to the function was empty or of an invalid type.
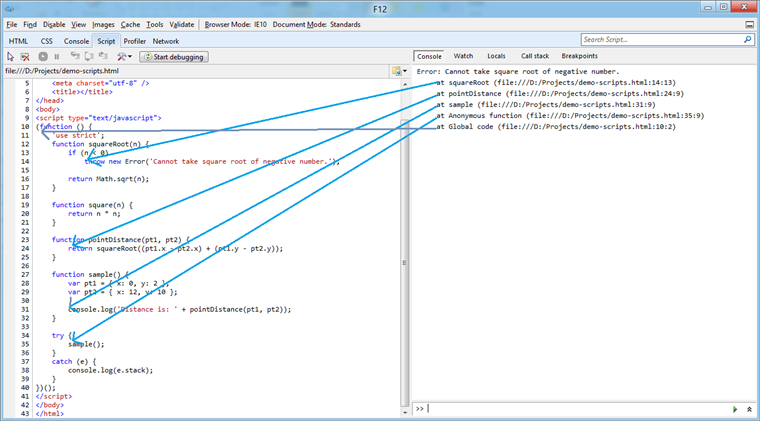
Let’s look at a simple script and start a deeper discussion. This script attempts to calculate the distance between the two points (0, 2) and (12, 10):
pointDistance function will return incorrect results; in other cases, the script will cause errors. To understand what the stack trace means, let's take a look at the error in the F12 Developer Tools and look at its Scripts tab:

stack trace will be dumped to the console in the catch clause, so errors originating in the squareRoot function will become obvious since it is at the top of the stack. In order to debug this issue, the developer does not need to look deeply into the stack trace; the system has violated the precondition of squareRoot, and it will become obvious just by looking one level up the stack: the subexpression within the squareRoot call The formula itself should be the parameter of square.
During debugging, the stack attribute will help identify the code used to set breakpoints. Keep in mind that you can also use other methods to view the call stack: For example, if you set the script debugger to "catch exceptions and break on" mode, you can use the debugger to examine the call stack. For deployed applications, you may consider merging the problematic code within try/catch to capture the failed call and log it to the server. Developers can then review the call stack to isolate the problem area.
Previously, I had noticed that the object being raised must be a Error or lead to a Error via its prototype chain. This is intentional; JavaScript can support raising any object, even primitives that are exceptions. Although all of these objects can be captured and inspected by the system, their full purpose is not to contain error or diagnostic information. Therefore, only the error's stack attributes will be updated during the raising process.
Even if objects are DOM exceptions, they do not contain a prototype chain leading to Error, so they will not contain stack attributes. In some application scenarios, you need to perform DOM manipulation and want to expose JavaScript-compatible errors, then you may want to merge your DOM manipulation code inside the try/catch data block and raise a new one in the catch clause The Error object:
Error is probably the right approach we need to choose.
Performance considerations
Construction of the stack trace begins when the error object is raised; constructing the stack trace requires viewing the current execution stack. To prevent performance issues when traversing very large stacks (and even possible recursive stack chains), IE will only collect the first ten stack frames by default. However this setting can be configured by setting the static property Error.stackTraceLimit to another value. This setting is global and must be changed before an error is raised, otherwise it will have no effect on the stack trace.
When a stack is generated by an asynchronous callback (such as timeout, interval, or XMLHttpRequest), the asynchronous callback (not the code created by the asynchronous callback) will be at the bottom of the call stack. This has some potential implications for tracing problematic code: if you use the same callback function for multiple asynchronous callbacks, it will be difficult to determine which callback is causing the error by individual inspection. Let's modify the previous example slightly, we will avoid calling sample() directly and instead put it into a timeout callback:
Anonymous function. In fact, this is not the same anonymous function, but the callback function passed to setTimeout. Since you lose the context associated with the pending callback, you may not be able to determine what called the callback. If in an application scenario, the system registers a callback to handle click events for many different buttons, then you will not be able to tell which callback the registration refers to. Having said that, this restriction is of limited use as in most cases the top of the stack will probably highlight the problem area.
Watch the experience demo

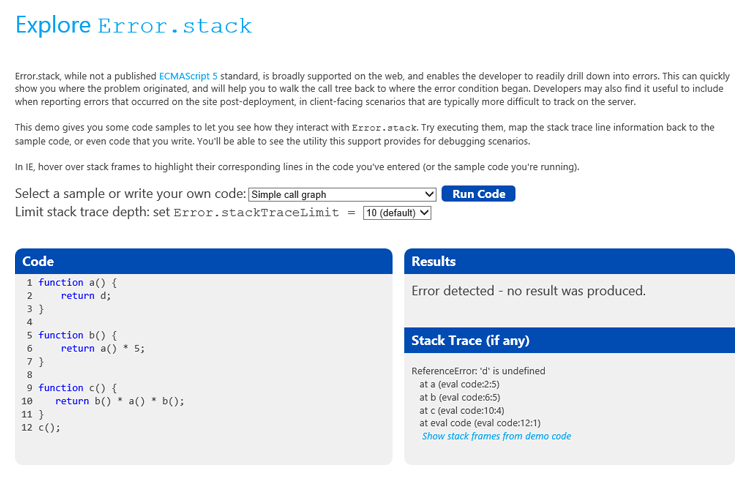
Learn about using IE10 in Windows 8 Consumer Preview. You can execute code in the context of eval and if an error occurs, you can check for it. If you're running the code within IE10, you can also highlight the erroring line of code since you can hover over it in the stack trace. You can enter your own code into the code area, or choose from several examples in the list. Additionally, you can set the Error.stackTraceLimit value when running the code example.
To view reference materials, please browse the related information Error.stack and <a target="_blank" href="http://msdn.microsoft.com/en-us/library%20MSDN%20documentation%20for%20/hh699849(v=vs.94).aspx">stackTraceLimit<code><a target="_blank" href="http://msdn.microsoft.com/en-us/library/hh699849(v=vs.94).aspx">stackTraceLimit</a>.


