

How to adjust front panel volume in Windows 10

Many friends have upgraded their drivers when using the win10 system, but they still have no sound from the front panel and don’t know how to adjust it. Today I will bring you a method to debug the front panel sound in win10. Come on. Let's see.
How to adjust the sound of the win10 debugging front panel:
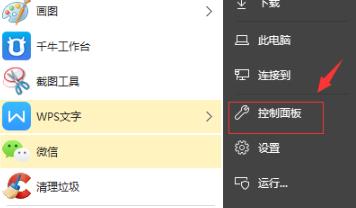
1. Click Start in the lower left corner and then open the "Control Panel".
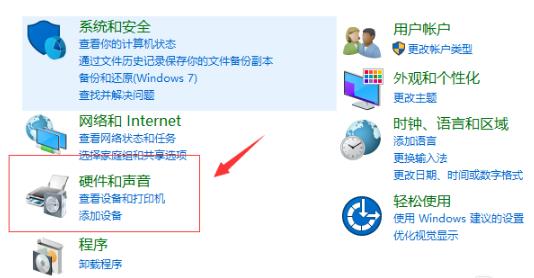
2. Open "Hardware and Sound" in the Control Panel.
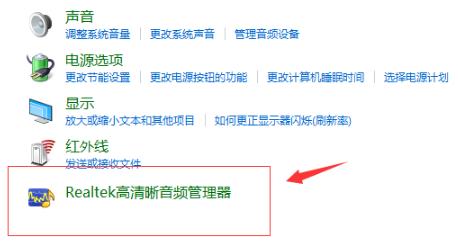
3. Then choose to open "Realtek High Definition Audio Manager".
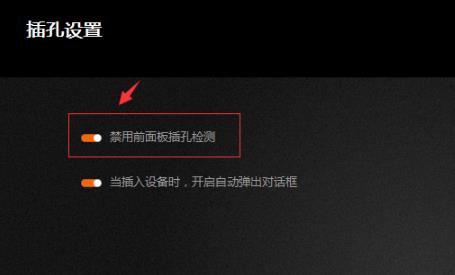
4. After entering, select "Jack Settings".
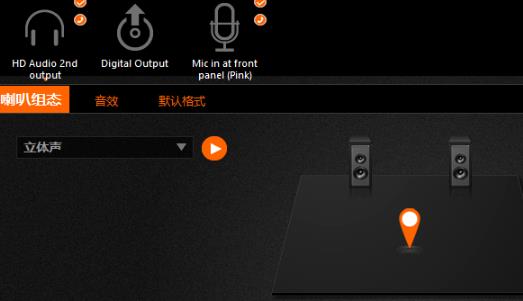
5. Turn on the switch in front of "Disable front panel jack detection" in the settings.
The above is the detailed content of How to adjust front panel volume in Windows 10. For more information, please follow other related articles on the PHP Chinese website!

Hot AI Tools

Undresser.AI Undress
AI-powered app for creating realistic nude photos

AI Clothes Remover
Online AI tool for removing clothes from photos.

Undress AI Tool
Undress images for free

Clothoff.io
AI clothes remover

Video Face Swap
Swap faces in any video effortlessly with our completely free AI face swap tool!

Hot Article
Hot Tools

Notepad++7.3.1
Easy-to-use and free code editor

SublimeText3 Chinese version
Chinese version, very easy to use

Zend Studio 13.0.1
Powerful PHP integrated development environment

Dreamweaver CS6
Visual web development tools

SublimeText3 Mac version
God-level code editing software (SublimeText3)
Hot Topics
 1386
1386
 52
52

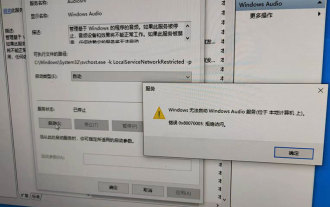 Windows cannot start the Windows Audio service Error 0x80070005
Jun 19, 2024 pm 01:08 PM
Windows cannot start the Windows Audio service Error 0x80070005
Jun 19, 2024 pm 01:08 PM
The guy's computer appears: Windows cannot start the WindowsAudio service (located on the local computer). Error 0x8007005: Access denied. This situation is usually caused by user permissions. You can try the following methods to fix it. Method 1: Modify the registry to add permissions through batch processing, create a new text document on the desktop, save it as .bat, and right-click the administrator to go far. Echo==========================EchoProcessingRegistryPermission.Pleasewait...Echo================== ========subinacl/subkey
 Detailed explanation of C++ function debugging: How to debug problems in multi-threaded functions?
May 02, 2024 pm 04:15 PM
Detailed explanation of C++ function debugging: How to debug problems in multi-threaded functions?
May 02, 2024 pm 04:15 PM
C++ multi-thread debugging can use GDB: 1. Enable debugging information compilation; 2. Set breakpoints; 3. Use infothreads to view threads; 4. Use thread to switch threads; 5. Use next, stepi, and locals to debug. Actual case debugging deadlock: 1. Use threadapplyallbt to print the stack; 2. Check the thread status; 3. Single-step the main thread; 4. Use condition variables to coordinate access to solve the deadlock.
 How to use LeakSanitizer to debug C++ memory leaks?
Jun 02, 2024 pm 09:46 PM
How to use LeakSanitizer to debug C++ memory leaks?
Jun 02, 2024 pm 09:46 PM
How to use LeakSanitizer to debug C++ memory leaks? Install LeakSanitizer. Enable LeakSanitizer via compile flag. Run the application and analyze the LeakSanitizer report. Identify memory allocation types and allocation locations. Fix memory leaks and ensure all dynamically allocated memory is released.
 Shortcut to golang function debugging and analysis
May 06, 2024 pm 10:42 PM
Shortcut to golang function debugging and analysis
May 06, 2024 pm 10:42 PM
This article introduces shortcuts for Go function debugging and analysis, including: built-in debugger dlv, which is used to pause execution, check variables, and set breakpoints. Logging, use the log package to record messages and view them during debugging. The performance analysis tool pprof generates call graphs and analyzes performance, and uses gotoolpprof to analyze data. Practical case: Analyze memory leaks through pprof and generate a call graph to display the functions that cause leaks.
 How to do efficient debugging in Java lambda expressions?
Apr 24, 2024 pm 12:03 PM
How to do efficient debugging in Java lambda expressions?
Apr 24, 2024 pm 12:03 PM
Efficiently debug Lambda expressions: IntelliJ IDEA Debugger: Set breakpoints on variable declarations or methods, inspect internal variables and state, and see the actual implementation class. Java9+JVMTI: Connect to the runtime JVM to obtain identifiers, inspect bytecode, set breakpoints, and monitor variables and status during execution.
 How to debug PHP asynchronous code
May 31, 2024 am 09:08 AM
How to debug PHP asynchronous code
May 31, 2024 am 09:08 AM
Tools for debugging PHP asynchronous code include: Psalm: a static analysis tool that can find potential errors. ParallelLint: A tool that inspects asynchronous code and provides recommendations. Xdebug: An extension for debugging PHP applications by enabling a session and stepping through the code. Other tips include using logging, assertions, running code locally, and writing unit tests.
 How to conduct concurrency testing and debugging in Java concurrent programming?
May 09, 2024 am 09:33 AM
How to conduct concurrency testing and debugging in Java concurrent programming?
May 09, 2024 am 09:33 AM
Concurrency testing and debugging Concurrency testing and debugging in Java concurrent programming are crucial and the following techniques are available: Concurrency testing: Unit testing: Isolate and test a single concurrent task. Integration testing: testing the interaction between multiple concurrent tasks. Load testing: Evaluate an application's performance and scalability under heavy load. Concurrency Debugging: Breakpoints: Pause thread execution and inspect variables or execute code. Logging: Record thread events and status. Stack trace: Identify the source of the exception. Visualization tools: Monitor thread activity and resource usage.
 What are the debugging techniques for recursive calls in Java functions?
May 05, 2024 am 10:48 AM
What are the debugging techniques for recursive calls in Java functions?
May 05, 2024 am 10:48 AM
The following techniques are available for debugging recursive functions: Check the stack traceSet debug pointsCheck if the base case is implemented correctlyCount the number of recursive callsVisualize the recursive stack
