

Explore new paths - Diagnostic tool for IO waiting

| Introduction | Recently I have been doing real-time synchronization of logs. Before going online, I did a single online log stress test. There were no problems with the message queue, the client, and the local machine, but I didn’t expect that after the second log was uploaded, , here comes the question: |
A certain machine in the cluster top saw a huge load. The hardware configuration of the machines in the cluster was the same, and the deployed software was the same, but there was a problem with the load on this one machine alone. I initially guessed that there might be a problem with the hardware.
At the same time, we also need to find out the culprit of the abnormal load, and then find solutions from the software and hardware levels.

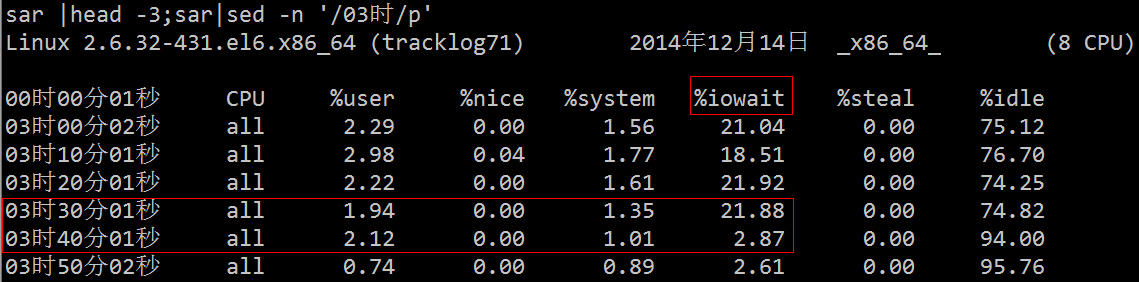
You can see from top that the load average is high, %wa is high, and %us is low:
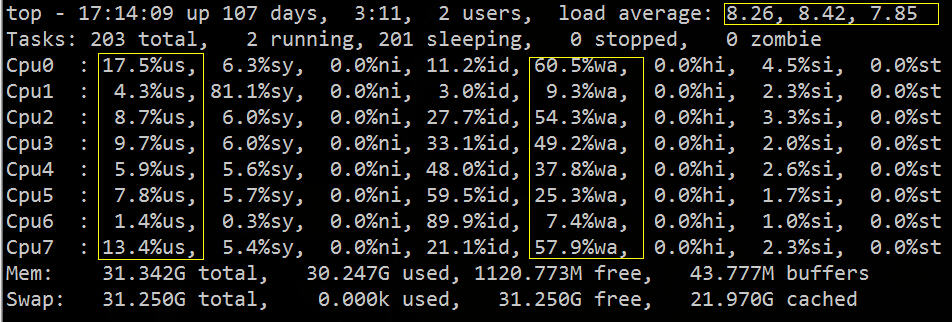
From the above figure, we can roughly infer that IO has encountered a bottleneck. Next, we can use related IO diagnostic tools for specific verification and troubleshooting.
Commonly used combination methods are as follows:
•Use vmstat, sar, iostat to detect whether it is a CPU bottleneck
•Use free and vmstat to detect whether there is a memory bottleneck
•Use iostat and dmesg to detect whether it is a disk I/O bottleneck
•Use netstat to detect network bandwidth bottlenecks
The meaning of the vmstat command is to display virtual memory status ("Virtual Memor Statics"), but it can report on the overall operating status of the system such as processes, memory, I/O, etc.
Its related fields are described as follows:
Procs(Process)
•r: The number of processes in the run queue. This value can also be used to determine whether the CPU needs to be increased. (long term greater than 1)
•b: The number of processes waiting for IO, that is, the number of processes in non-interruptible sleep state, showing the number of tasks that are executing and waiting for CPU resources. When this value exceeds the number of CPUs, a CPU bottleneck will occur
Memory
•swpd: Use virtual memory size. If the value of swpd is not 0, but the values of SI and SO are 0 for a long time, this situation will not affect system performance.
•free: Free physical memory size.
•buff: The size of memory used as buffer.
•cache: The memory size used as cache. If the cache value is large, it means that there are many files in the cache. If frequently accessed files can be cached, the read IO bi of the disk will be very small.
Swap(swap area)
•si: The size written from the swap area to the memory per second, which is transferred into the memory from the disk.
•so: The memory size written to the swap area per second, transferred from memory to disk.
Note: When the memory is sufficient, these two values are both 0. If these two values are greater than 0 for a long time, system performance will be affected, and disk IO and CPU resources will be consumed. Some friends think that the memory is not enough when they see that the free memory (free) is very small or close to 0. You can't just look at this, but also combine si and so. If there is very little free, there are also very few si and so. (Most of the time it is 0), then don’t worry, system performance will not be affected at this time.
IO (input and output)
(The current Linux version block size is 1kb)
•bi: Number of blocks read per second
•bo: Number of blocks written per second
Note: When reading and writing random disks, the larger these two values are (such as exceeding 1024k), the larger the value you can see that the CPU is waiting for IO.
system
•in: Number of interrupts per second, including clock interrupts.
•cs: Number of context switches per second.
Note: The larger the above two values are, the greater the CPU time consumed by the kernel will be.
CPU
(expressed as a percentage)
•us: Percentage of user process execution time (user time). When the value of us is relatively high, it means that the user process consumes a lot of CPU time, but if the usage exceeds 50% for a long time, then we should consider optimizing the program algorithm or accelerating it.
•sy: Percentage of kernel system process execution time (system time). When the value of sy is high, it means that the system kernel consumes a lot of CPU resources. This is not a benign performance and we should check the reason.
•wa: IO waiting time percentage. When the value of wa is high, it means that the IO wait is serious. This may be caused by a large number of random accesses on the disk, or there may be a bottleneck (block operation) on the disk.
•id: idle time percentage
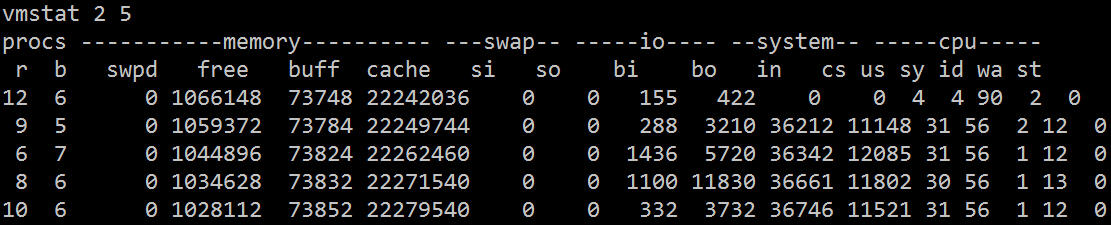
As can be seen from vmstat, most of the CPU's time is wasted waiting for IO, which may be caused by a large number of random disk accesses or disk bandwidth. Bi and bo also exceed 1024k, which should be caused by IO. bottleneck.
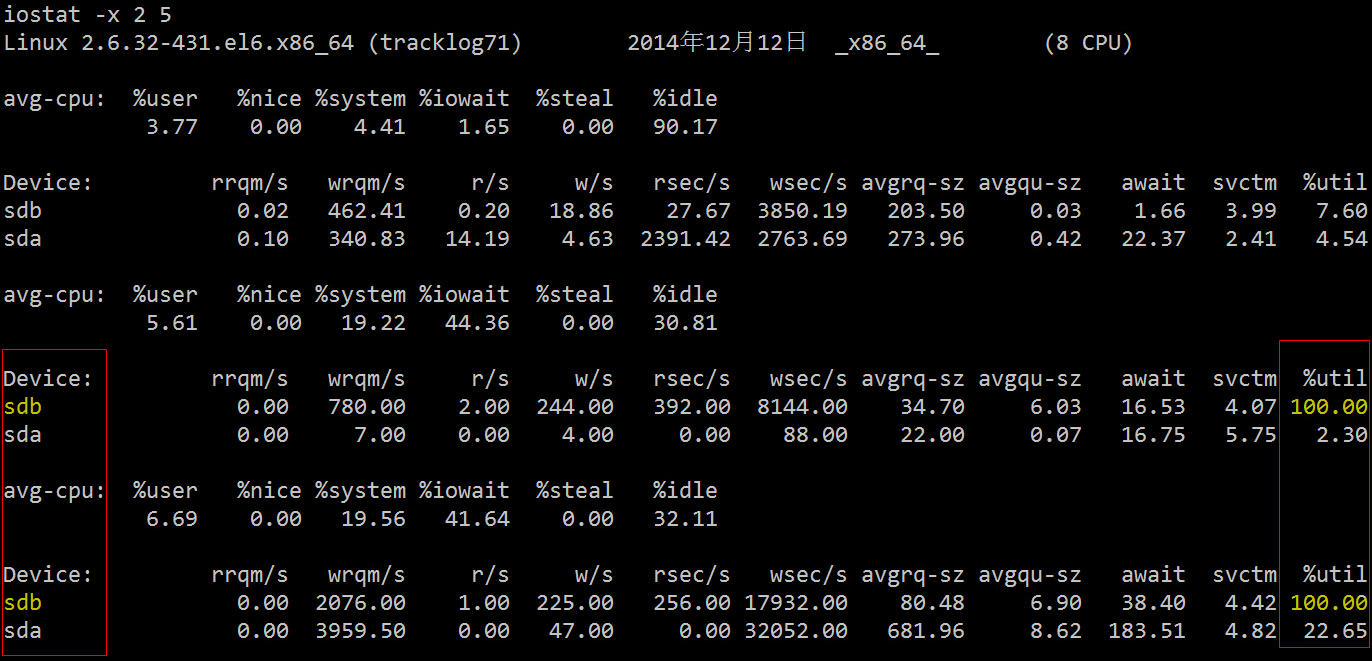
2.2 iostat Let’s use a more professional disk IO diagnostic tool to look at the relevant statistics.
Its related fields are described as follows:
•rrqm/s: The number of merge read operations per second. That is delta(rmerge)/s
•wrqm/s: The number of merge write operations per second. That is delta(wmerge)/s
•r/s: The number of reads from the I/O device completed per second. That is delta(rio)/s
•w/s: Number of writes to the I/O device completed per second. That is delta(wio)/s
•rsec/s: Number of sectors read per second. That is delta(rsect)/s
•wsec/s: Number of sectors written per second. That is delta(wsect)/s
•rkB/s: K bytes read per second. Is half of rsect/s because each sector size is 512 bytes. (needs calculation)
•wkB/s: Number of K bytes written per second. is half of wsect/s. (needs calculation)
•avgrq-sz: Average data size (sectors) per device I/O operation. delta(rsect wsect)/delta(rio wio)
•avgqu-sz: Average I/O queue length. That is delta(aveq)/s/1000 (because the unit of aveq is milliseconds).
•await: average waiting time (milliseconds) for each device I/O operation. That is delta(ruse wuse)/delta(rio wio)
•svctm: Average service time (milliseconds) of each device I/O operation. That is delta(use)/delta(rio wio)
•%util: What percentage of a second is used for I/O operations, or how much of a second the I/O queue is non-empty. That is delta(use)/s/1000 (because the unit of use is milliseconds)
You can see that the utilization rate of sdb in the two hard disks is 100%, and there is a serious IO bottleneck. The next step is to find out which process is reading and writing data to this hard disk.
2.3 iotop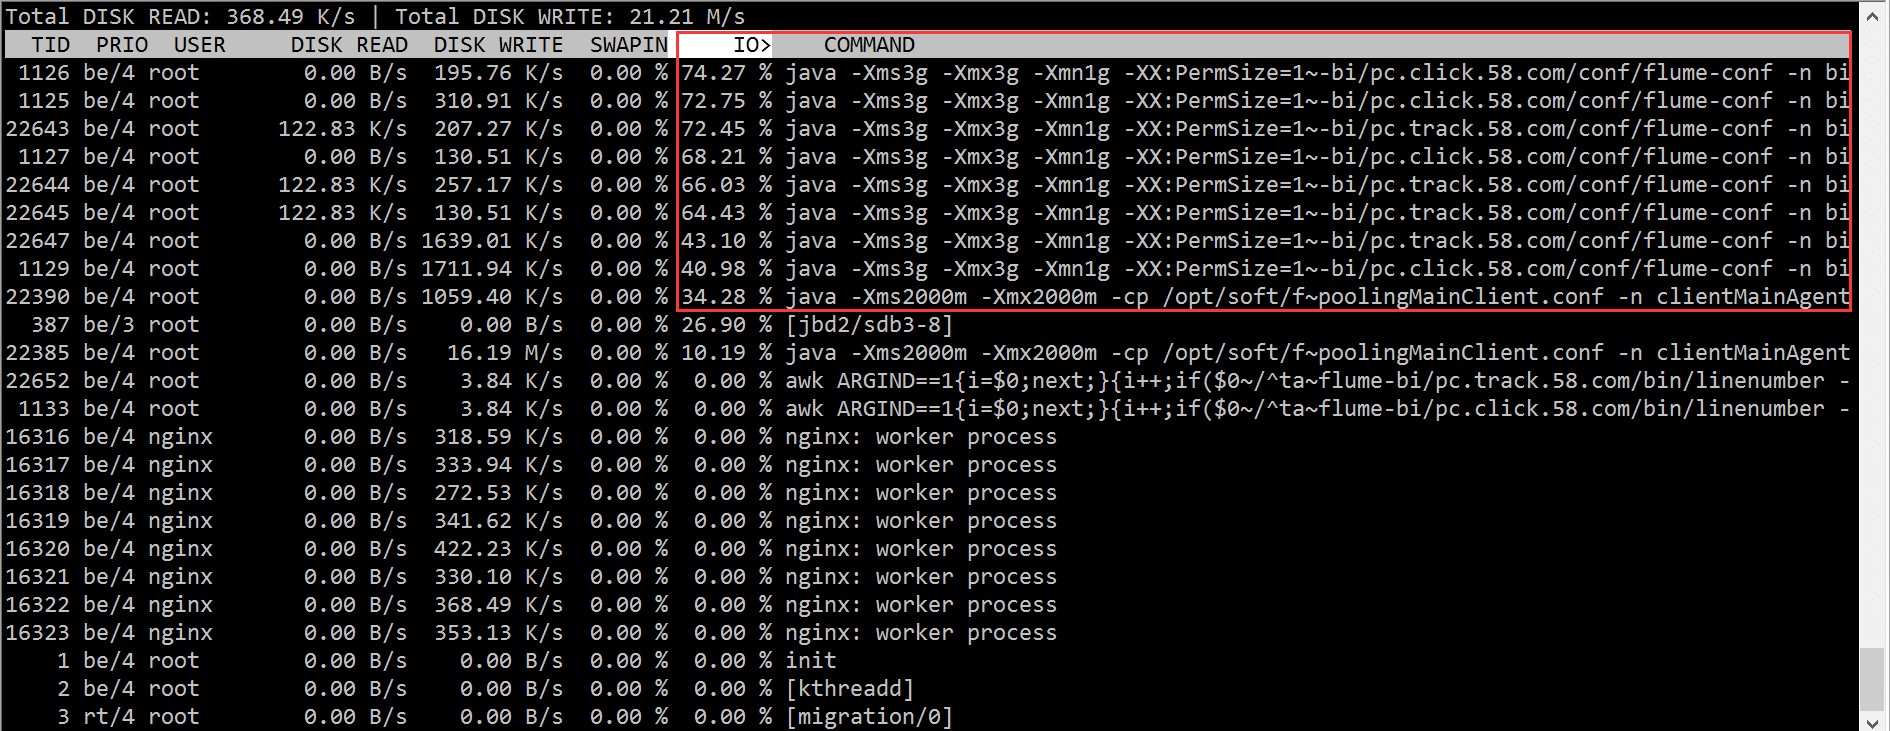
According to the iotop results, we quickly located the problem with the flume process, which caused a large number of IO waits.
But as I said at the beginning, the machine configurations in the cluster are the same, and the deployed programs are exactly the same as rsync. Is it because the hard disk is broken?
This has to be verified by an operation and maintenance student. The final conclusion is:
Sdb is a dual-disk raid1, the raid card used is "LSI Logic/Symbios Logic SAS1068E", and there is no cache. The pressure of nearly 400 IOPS has reached the hardware limit. The raid card used by other machines is "LSI Logic / Symbios Logic MegaRAID SAS 1078", which has a 256MB cache and has not reached the hardware bottleneck. The solution is to replace the machine with a larger IOPS. For example, we finally changed to a machine with PERC6 /i Machines with integrated RAID controller cards. It should be noted that the RAID information is stored in the RAID card and the disk firmware. The RAID information on the disk and the information format on the RAID card must match. Otherwise, the RAID card cannot recognize it and the disk needs to be formatted.
IOPS essentially depends on the disk itself, but there are many ways to improve IOPS. Adding hardware cache and using RAID arrays are common methods. If it is a scenario like DB with high IOPS, it is now popular to use SSD to replace the traditional mechanical hard disk.
But as mentioned before, our purpose of starting from both the software and hardware aspects is to see if we can find the least expensive solution respectively:
Now that we know the hardware reason, we can try to move the read and write operations to another disk, and then see the effect:
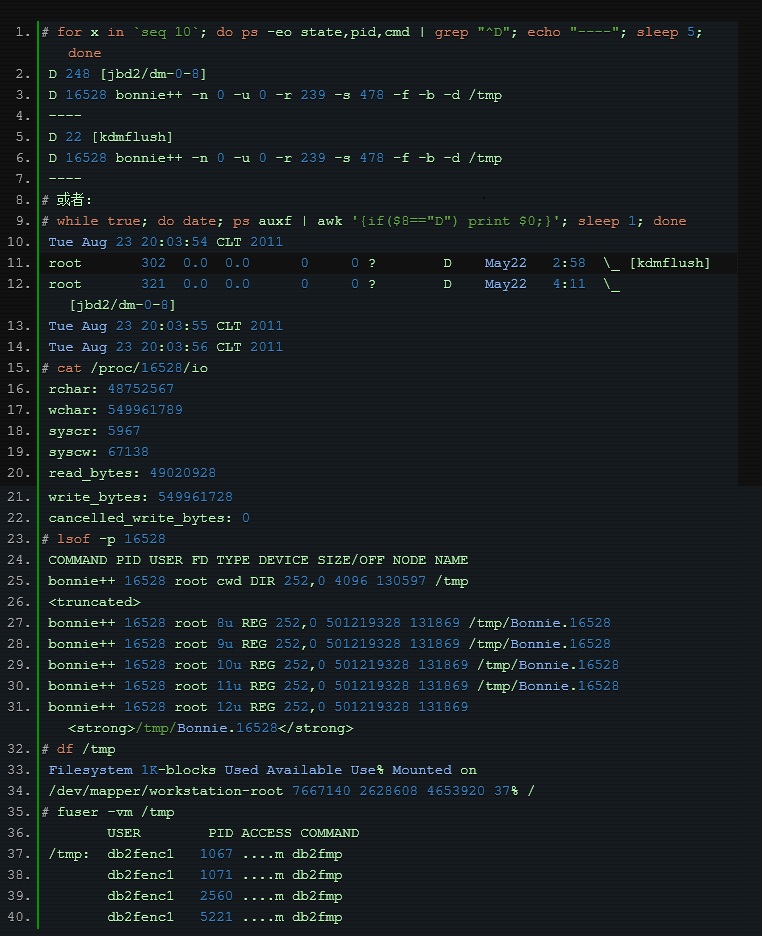
In fact, in addition to using the above-mentioned professional tools to locate this problem, we can directly use the process status to find the relevant processes.
We know that the process has the following states:
•D uninterruptible sleep (usually IO)
•R running or runnable (on run queue)
•S interruptible sleep (waiting for an event to complete)
•T stopped, either by a job control signal or because it is being traced.
•W paging (not valid since the 2.6.xx kernel)
•X dead (should never be seen)
•Z defunct ("zombie") process, terminated but not reaped by its parent.
The state of D is generally the so-called "non-interruptible sleep" caused by wait IO. We can start from this point and then locate the problem step by step:
The above is the detailed content of Explore new paths - Diagnostic tool for IO waiting. For more information, please follow other related articles on the PHP Chinese website!

Hot AI Tools

Undresser.AI Undress
AI-powered app for creating realistic nude photos

AI Clothes Remover
Online AI tool for removing clothes from photos.

Undress AI Tool
Undress images for free

Clothoff.io
AI clothes remover

AI Hentai Generator
Generate AI Hentai for free.

Hot Article
Hot Tools

Notepad++7.3.1
Easy-to-use and free code editor

SublimeText3 Chinese version
Chinese version, very easy to use

Zend Studio 13.0.1
Powerful PHP integrated development environment

Dreamweaver CS6
Visual web development tools

SublimeText3 Mac version
God-level code editing software (SublimeText3)
Hot Topics


 deepseek web version entrance deepseek official website entrance
Feb 19, 2025 pm 04:54 PM
deepseek web version entrance deepseek official website entrance
Feb 19, 2025 pm 04:54 PM
DeepSeek is a powerful intelligent search and analysis tool that provides two access methods: web version and official website. The web version is convenient and efficient, and can be used without installation; the official website provides comprehensive product information, download resources and support services. Whether individuals or corporate users, they can easily obtain and analyze massive data through DeepSeek to improve work efficiency, assist decision-making and promote innovation.
 How to install deepseek
Feb 19, 2025 pm 05:48 PM
How to install deepseek
Feb 19, 2025 pm 05:48 PM
There are many ways to install DeepSeek, including: compile from source (for experienced developers) using precompiled packages (for Windows users) using Docker containers (for most convenient, no need to worry about compatibility) No matter which method you choose, Please read the official documents carefully and prepare them fully to avoid unnecessary trouble.
 BITGet official website installation (2025 beginner's guide)
Feb 21, 2025 pm 08:42 PM
BITGet official website installation (2025 beginner's guide)
Feb 21, 2025 pm 08:42 PM
BITGet is a cryptocurrency exchange that provides a variety of trading services including spot trading, contract trading and derivatives. Founded in 2018, the exchange is headquartered in Singapore and is committed to providing users with a safe and reliable trading platform. BITGet offers a variety of trading pairs, including BTC/USDT, ETH/USDT and XRP/USDT. Additionally, the exchange has a reputation for security and liquidity and offers a variety of features such as premium order types, leveraged trading and 24/7 customer support.
 Ouyi okx installation package is directly included
Feb 21, 2025 pm 08:00 PM
Ouyi okx installation package is directly included
Feb 21, 2025 pm 08:00 PM
Ouyi OKX, the world's leading digital asset exchange, has now launched an official installation package to provide a safe and convenient trading experience. The OKX installation package of Ouyi does not need to be accessed through a browser. It can directly install independent applications on the device, creating a stable and efficient trading platform for users. The installation process is simple and easy to understand. Users only need to download the latest version of the installation package and follow the prompts to complete the installation step by step.
 Get the gate.io installation package for free
Feb 21, 2025 pm 08:21 PM
Get the gate.io installation package for free
Feb 21, 2025 pm 08:21 PM
Gate.io is a popular cryptocurrency exchange that users can use by downloading its installation package and installing it on their devices. The steps to obtain the installation package are as follows: Visit the official website of Gate.io, click "Download", select the corresponding operating system (Windows, Mac or Linux), and download the installation package to your computer. It is recommended to temporarily disable antivirus software or firewall during installation to ensure smooth installation. After completion, the user needs to create a Gate.io account to start using it.
 Ouyi Exchange Download Official Portal
Feb 21, 2025 pm 07:51 PM
Ouyi Exchange Download Official Portal
Feb 21, 2025 pm 07:51 PM
Ouyi, also known as OKX, is a world-leading cryptocurrency trading platform. The article provides a download portal for Ouyi's official installation package, which facilitates users to install Ouyi client on different devices. This installation package supports Windows, Mac, Android and iOS systems. Users can choose the corresponding version to download according to their device type. After the installation is completed, users can register or log in to the Ouyi account, start trading cryptocurrencies and enjoy other services provided by the platform.
 gate.io official website registration installation package link
Feb 21, 2025 pm 08:15 PM
gate.io official website registration installation package link
Feb 21, 2025 pm 08:15 PM
Gate.io is a highly acclaimed cryptocurrency trading platform known for its extensive token selection, low transaction fees and a user-friendly interface. With its advanced security features and excellent customer service, Gate.io provides traders with a reliable and convenient cryptocurrency trading environment. If you want to join Gate.io, please click the link provided to download the official registration installation package to start your cryptocurrency trading journey.
 How to Install phpMyAdmin with Nginx on Ubuntu?
Feb 07, 2025 am 11:12 AM
How to Install phpMyAdmin with Nginx on Ubuntu?
Feb 07, 2025 am 11:12 AM
This tutorial guides you through installing and configuring Nginx and phpMyAdmin on an Ubuntu system, potentially alongside an existing Apache server. We'll cover setting up Nginx, resolving potential port conflicts with Apache, installing MariaDB (
