Excel tables are often used in our daily work. It is not only a simple data recording software, but also allows us to perform some simple data analysis and processing. However, many users do not know how to set it up. Win7Excel data analysis, today's article will give you a detailed explanation of its setting method.
1. First we need to open an Excel table,
Then we continue to add the data analysis plug-in.
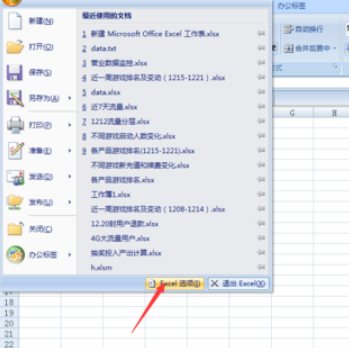
First we click the button in the upper left corner, where you can see the drop-down menu column.
We select the "Excel Options" button in the lower right corner of the menu interface.

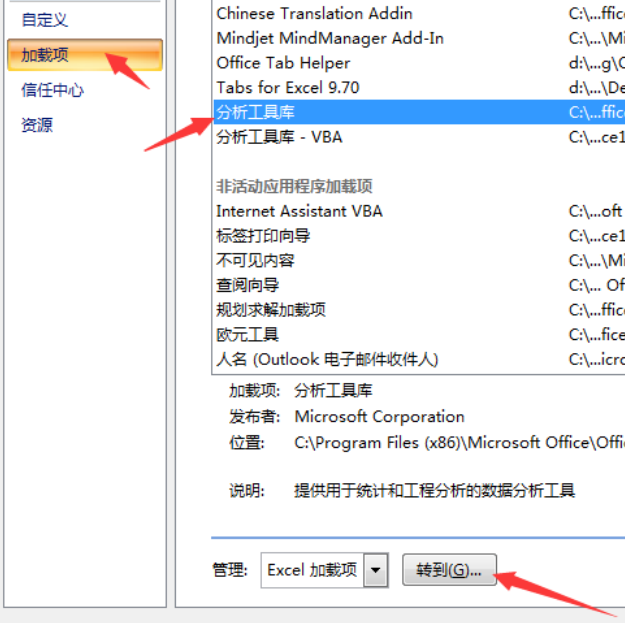
2. Then in the pop-up window, we click on the add-on.
Then select the Analysis Tool Library and click the Go button below.

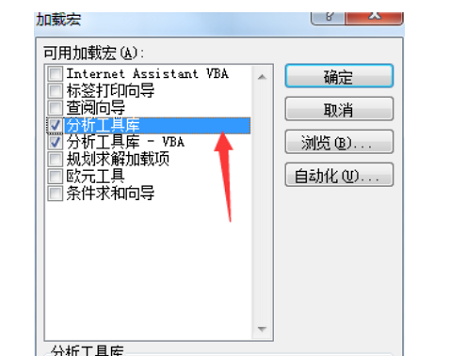
3. At this time we will come to the Excel add-in page.
At this time we check the box in front of the Analysis Tool Library item and click OK.

4. After the above steps, we have successfully added the data analysis plug-in.
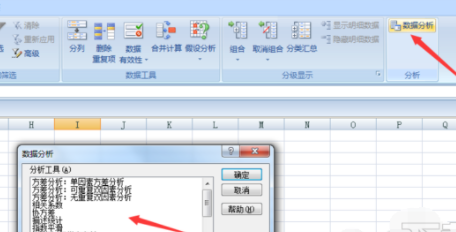
Then we click on the data one by one, the data analysis on the far right.
You can see some related analysis methods in it.
Such as regression analysis, correlation analysis, etc.

The above is the detailed content of Win7 tutorial on using Excel for data analysis. For more information, please follow other related articles on the PHP Chinese website!
 Data analysis methods
 Compare the similarities and differences between two columns of data in excel
 excel duplicate item filter color
 How to copy an Excel table to make it the same size as the original
 Excel table slash divided into two
 Excel diagonal header is divided into two
 What are the data analysis methods?
 Absolute reference input method


