

Learn how to use the command line tool sxstrace.exe effectively

Many friends who use win10 system have encountered this problem when playing games or installing the system. The application cannot be started because the parallel configuration of the application is incorrect. For more information, see the application event log, or use the command line sxstrace.exe tool. This may be because the operating system does not have corresponding permissions. Let’s take a look at the specific tutorial below.
Tutorial on using the command line sxstrace.exe tool
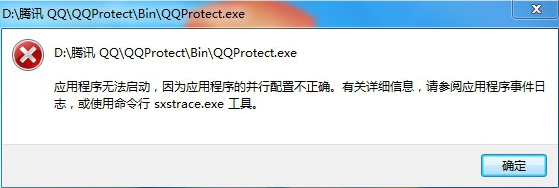
1. This problem usually occurs when installing programs and games. The prompt is:
The application cannot be started because the application's side-by-side configuration is incorrect. For more information, see the application event log, or use the command line sxstrace.exe tool.
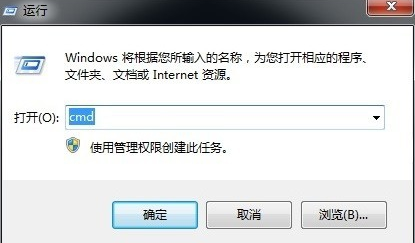
2. Start → Run → Enter: CMD and click OK (or press Enter) to open the command prompt window.
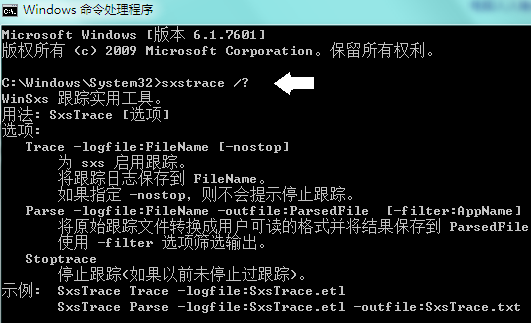
3. If you want to know how to use it, you can enter the command plus a question mark to query the parameters: sxstrace.exe/?
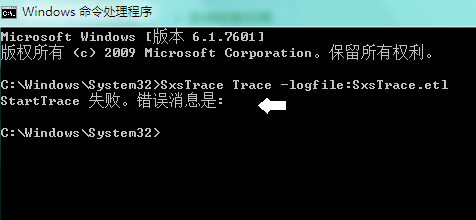
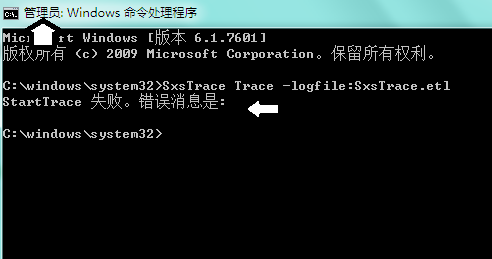
4. If you enter the tracing command: SxsTrace Trace -logfile:SxsTrace.etl, the following prompt will pop up: SxsTrace failed. The error message is: It may be that the operating system does not have the corresponding permissions
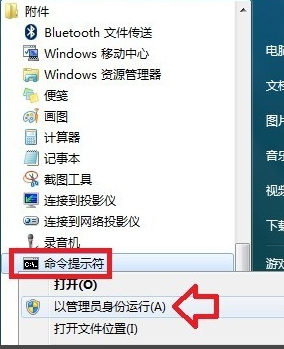
5. Start → All Programs → Attachments → Right-click Command Prompt → Run as administrator.
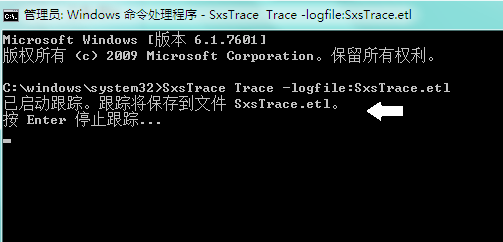
6. Enter the command again in the command prompt window with administrator rights, and there will be a startup prompt:
SxsTrace Trace -logfile:SxsTrace .etl
There are two important pieces of information here. One is that the traced information is saved in the SxsTrace.etl file
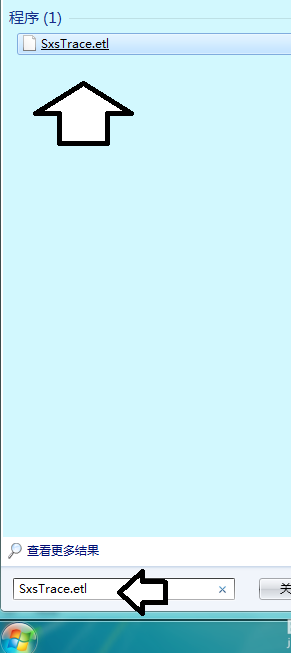
7. Search in the start menu Enter: SxsTrace.etl file name in the box to find the file and check the cause of the error and other information.
8. Another important message is that you can stop tracking by pressing Enter (Enter key). If you do not stop tracing, even if you open a command prompt window with administrator rights and enter the tracing command, an error will still occur.
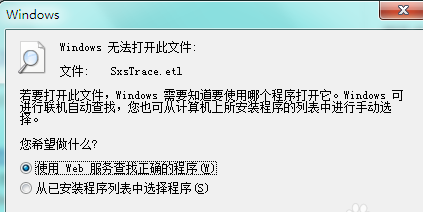
9. Double-clicking the SxsTrace.etl file requires a special It can only be viewed after the program is associated with it.
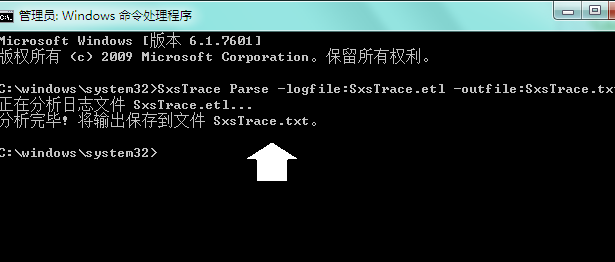
10. You can also use this command at this time:
SxsTrace Parse -logfile:SxsTrace.etl -outfile:SxsTrace.txt
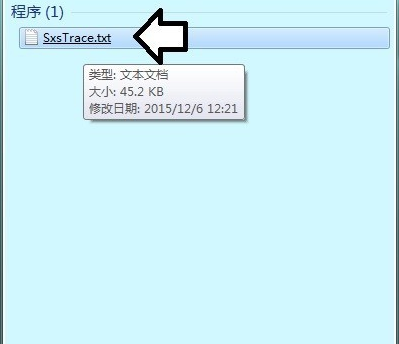
11. Then search for the SxsTrace.txt file and you can view it directly in Notepad
12. If you see the traced information If you don’t understand, you can try to open the installation service
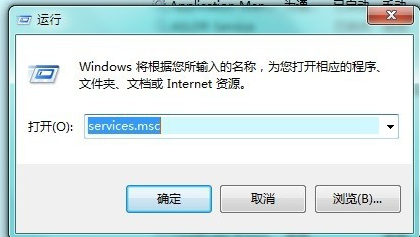
Start→Run→Enter: services.msc Click OK (or press Enter) to open the service
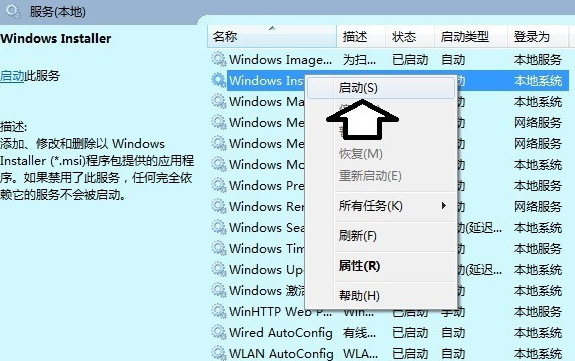
13 . Find the Windows Installer service and right-click to start it.
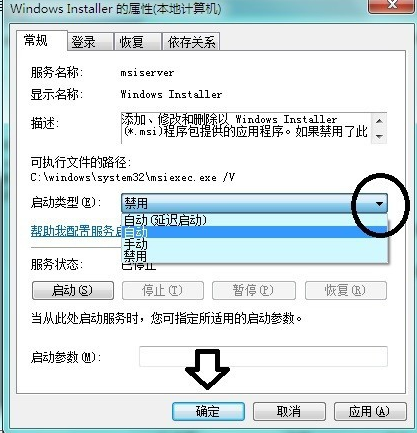
14. If the startup menu is gray (unavailable) Service Properties → Startup Type → Automatic or Manual → Apply → Start → OK.
15. Another situation is that different operating system versions use the wrong version of the C runtime library program, which will also cause system failures and error messages. Solution: Found Just install the version that matches the operating system.

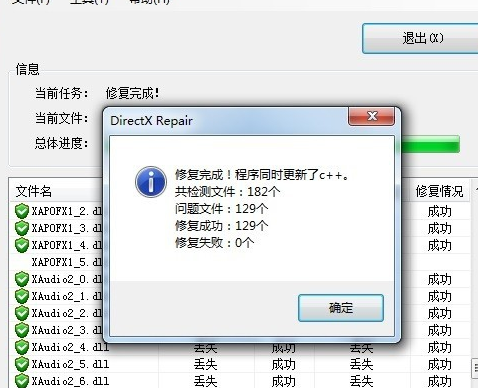
16. Of course, you can also use special tools to repair system files (pay attention to the number of files repaired, if it is 0, it means there is no repair, or the system failure is not caused by this reason).
Windows settings related issues
What is werfault.exe>>>
Werfault.exe application error> >>
How to solve the blue screen code 0X000000ED>>>
The above is the detailed content of Learn how to use the command line tool sxstrace.exe effectively. For more information, please follow other related articles on the PHP Chinese website!

Hot AI Tools

Undresser.AI Undress
AI-powered app for creating realistic nude photos

AI Clothes Remover
Online AI tool for removing clothes from photos.

Undress AI Tool
Undress images for free

Clothoff.io
AI clothes remover

Video Face Swap
Swap faces in any video effortlessly with our completely free AI face swap tool!

Hot Article
Hot Tools

Notepad++7.3.1
Easy-to-use and free code editor

SublimeText3 Chinese version
Chinese version, very easy to use

Zend Studio 13.0.1
Powerful PHP integrated development environment

Dreamweaver CS6
Visual web development tools

SublimeText3 Mac version
God-level code editing software (SublimeText3)
Hot Topics
 1386
1386
 52
52

 How to solve the complexity of WordPress installation and update using Composer
Apr 17, 2025 pm 10:54 PM
How to solve the complexity of WordPress installation and update using Composer
Apr 17, 2025 pm 10:54 PM
When managing WordPress websites, you often encounter complex operations such as installation, update, and multi-site conversion. These operations are not only time-consuming, but also prone to errors, causing the website to be paralyzed. Combining the WP-CLI core command with Composer can greatly simplify these tasks, improve efficiency and reliability. This article will introduce how to use Composer to solve these problems and improve the convenience of WordPress management.
 Solve database connection problem: a practical case of using minii/db library
Apr 18, 2025 am 07:09 AM
Solve database connection problem: a practical case of using minii/db library
Apr 18, 2025 am 07:09 AM
I encountered a tricky problem when developing a small application: the need to quickly integrate a lightweight database operation library. After trying multiple libraries, I found that they either have too much functionality or are not very compatible. Eventually, I found minii/db, a simplified version based on Yii2 that solved my problem perfectly.
 Accelerate PHP code inspection: Experience and practice using overtrue/phplint library
Apr 17, 2025 pm 11:06 PM
Accelerate PHP code inspection: Experience and practice using overtrue/phplint library
Apr 17, 2025 pm 11:06 PM
During the development process, we often need to perform syntax checks on PHP code to ensure the correctness and maintainability of the code. However, when the project is large, the single-threaded syntax checking process can become very slow. Recently, I encountered this problem in my project. After trying multiple methods, I finally found the library overtrue/phplint, which greatly improves the speed of code inspection through parallel processing.
 How to optimize website performance: Experiences and lessons learned from using the Minify library
Apr 17, 2025 pm 11:18 PM
How to optimize website performance: Experiences and lessons learned from using the Minify library
Apr 17, 2025 pm 11:18 PM
In the process of developing a website, improving page loading has always been one of my top priorities. Once, I tried using the Miniify library to compress and merge CSS and JavaScript files in order to improve the performance of the website. However, I encountered many problems and challenges during use, which eventually made me realize that Miniify may no longer be the best choice. Below I will share my experience and how to install and use Minify through Composer.
 Solve CSS prefix problem using Composer: Practice of padaliyajay/php-autoprefixer library
Apr 17, 2025 pm 11:27 PM
Solve CSS prefix problem using Composer: Practice of padaliyajay/php-autoprefixer library
Apr 17, 2025 pm 11:27 PM
I'm having a tricky problem when developing a front-end project: I need to manually add a browser prefix to the CSS properties to ensure compatibility. This is not only time consuming, but also error-prone. After some exploration, I discovered the padaliyajay/php-autoprefixer library, which easily solved my troubles with Composer.
 Solve the PHP timeout problem: application of phpunit/php-invoker library
Apr 17, 2025 pm 11:45 PM
Solve the PHP timeout problem: application of phpunit/php-invoker library
Apr 17, 2025 pm 11:45 PM
When developing PHP projects, you often encounter the problem that some functions or methods have been executed for too long, causing program timeout. I've tried multiple solutions, but the results are not satisfactory until I discovered the phpunit/php-invoker library. This library completely solved my problem by setting the timeout time to call the executable function.
 Solve caching issues in Craft CMS: Using wiejeben/craft-laravel-mix plug-in
Apr 18, 2025 am 09:24 AM
Solve caching issues in Craft CMS: Using wiejeben/craft-laravel-mix plug-in
Apr 18, 2025 am 09:24 AM
When developing websites using CraftCMS, you often encounter resource file caching problems, especially when you frequently update CSS and JavaScript files, old versions of files may still be cached by the browser, causing users to not see the latest changes in time. This problem not only affects the user experience, but also increases the difficulty of development and debugging. Recently, I encountered similar troubles in my project, and after some exploration, I found the plugin wiejeben/craft-laravel-mix, which perfectly solved my caching problem.
 How to solve TYPO3CMS installation and configuration problems? It can be done easily with Composer!
Apr 17, 2025 pm 10:51 PM
How to solve TYPO3CMS installation and configuration problems? It can be done easily with Composer!
Apr 17, 2025 pm 10:51 PM
When using TYPO3CMS for website development, you often encounter problems with installation and configuration extensions. Especially for beginners, how to properly install and configure TYPO3 and its extensions can be a headache. I had similar difficulties in my actual project and ended up solving these problems by using Composer and TYPO3CMSComposerInstallers.
