
 System Tutorial
Windows Series
How to solve the problem of win11 being very slow when not plugged in
System Tutorial
Windows Series
How to solve the problem of win11 being very slow when not plugged in
How to solve the problem of win11 being very slow when not plugged in

Some friends who use laptops have found that their computers are stuck as long as they are not plugged in. This is actually because we enter the power-saving mode by default after unplugging the power supply. This can be solved by switching to the performance mode.
win11 is very slow when not plugged in:
1. First, we unplug the power, then click on the "Start Menu" at the bottom

2. Then search for and open "Control Panel"

3. Then change the viewing mode in the upper right corner to "Large Icons"

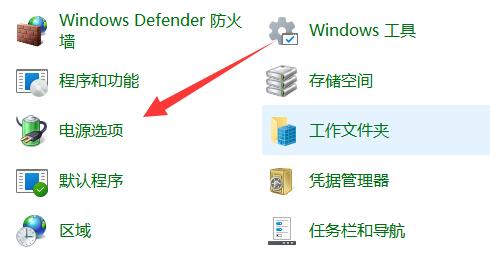
4. Then open the "Power Options"
5. Finally, change the plan As "high performance" can be solved.

The above is the detailed content of How to solve the problem of win11 being very slow when not plugged in. For more information, please follow other related articles on the PHP Chinese website!

Hot AI Tools

Undresser.AI Undress
AI-powered app for creating realistic nude photos

AI Clothes Remover
Online AI tool for removing clothes from photos.

Undress AI Tool
Undress images for free

Clothoff.io
AI clothes remover

Video Face Swap
Swap faces in any video effortlessly with our completely free AI face swap tool!

Hot Article
Hot Tools

Notepad++7.3.1
Easy-to-use and free code editor

SublimeText3 Chinese version
Chinese version, very easy to use

Zend Studio 13.0.1
Powerful PHP integrated development environment

Dreamweaver CS6
Visual web development tools

SublimeText3 Mac version
God-level code editing software (SublimeText3)
Hot Topics
 1664
1664
 14
1422
52
1316
25
1267
29
1239
24
14
1422
52
1316
25
1267
29
1239
24

 Performance optimization and horizontal expansion technology of Go framework?
Jun 03, 2024 pm 07:27 PM
Performance optimization and horizontal expansion technology of Go framework?
Jun 03, 2024 pm 07:27 PM
In order to improve the performance of Go applications, we can take the following optimization measures: Caching: Use caching to reduce the number of accesses to the underlying storage and improve performance. Concurrency: Use goroutines and channels to execute lengthy tasks in parallel. Memory Management: Manually manage memory (using the unsafe package) to further optimize performance. To scale out an application we can implement the following techniques: Horizontal Scaling (Horizontal Scaling): Deploying application instances on multiple servers or nodes. Load balancing: Use a load balancer to distribute requests to multiple application instances. Data sharding: Distribute large data sets across multiple databases or storage nodes to improve query performance and scalability.
 C++ Performance Optimization Guide: Discover the secrets to making your code more efficient
Jun 01, 2024 pm 05:13 PM
C++ Performance Optimization Guide: Discover the secrets to making your code more efficient
Jun 01, 2024 pm 05:13 PM
C++ performance optimization involves a variety of techniques, including: 1. Avoiding dynamic allocation; 2. Using compiler optimization flags; 3. Selecting optimized data structures; 4. Application caching; 5. Parallel programming. The optimization practical case shows how to apply these techniques when finding the longest ascending subsequence in an integer array, improving the algorithm efficiency from O(n^2) to O(nlogn).
 Nginx Performance Tuning: Optimizing for Speed and Low Latency
Apr 05, 2025 am 12:08 AM
Nginx Performance Tuning: Optimizing for Speed and Low Latency
Apr 05, 2025 am 12:08 AM
Nginx performance tuning can be achieved by adjusting the number of worker processes, connection pool size, enabling Gzip compression and HTTP/2 protocols, and using cache and load balancing. 1. Adjust the number of worker processes and connection pool size: worker_processesauto; events{worker_connections1024;}. 2. Enable Gzip compression and HTTP/2 protocol: http{gzipon;server{listen443sslhttp2;}}. 3. Use cache optimization: http{proxy_cache_path/path/to/cachelevels=1:2k
 The Way to Optimization: Exploring the Performance Improvement Journey of Java Framework
Jun 01, 2024 pm 07:07 PM
The Way to Optimization: Exploring the Performance Improvement Journey of Java Framework
Jun 01, 2024 pm 07:07 PM
The performance of Java frameworks can be improved by implementing caching mechanisms, parallel processing, database optimization, and reducing memory consumption. Caching mechanism: Reduce the number of database or API requests and improve performance. Parallel processing: Utilize multi-core CPUs to execute tasks simultaneously to improve throughput. Database optimization: optimize queries, use indexes, configure connection pools, and improve database performance. Reduce memory consumption: Use lightweight frameworks, avoid leaks, and use analysis tools to reduce memory consumption.
 How to quickly diagnose PHP performance issues
Jun 03, 2024 am 10:56 AM
How to quickly diagnose PHP performance issues
Jun 03, 2024 am 10:56 AM
Effective techniques for quickly diagnosing PHP performance issues include using Xdebug to obtain performance data and then analyzing the Cachegrind output. Use Blackfire to view request traces and generate performance reports. Examine database queries to identify inefficient queries. Analyze memory usage, view memory allocations and peak usage.
 The impact of exception handling on Java framework performance optimization
Jun 03, 2024 pm 06:34 PM
The impact of exception handling on Java framework performance optimization
Jun 03, 2024 pm 06:34 PM
Exception handling affects Java framework performance because when an exception occurs, execution is paused and the exception logic is processed. Tips for optimizing exception handling include: caching exception messages using specific exception types using suppressed exceptions to avoid excessive exception handling
 Optimizing rocket engine performance using C++
Jun 01, 2024 pm 04:14 PM
Optimizing rocket engine performance using C++
Jun 01, 2024 pm 04:14 PM
By building mathematical models, conducting simulations and optimizing parameters, C++ can significantly improve rocket engine performance: Build a mathematical model of a rocket engine and describe its behavior. Simulate engine performance and calculate key parameters such as thrust and specific impulse. Identify key parameters and search for optimal values using optimization algorithms such as genetic algorithms. Engine performance is recalculated based on optimized parameters to improve its overall efficiency.
 How to use profiling in Java to optimize performance?
Jun 01, 2024 pm 02:08 PM
How to use profiling in Java to optimize performance?
Jun 01, 2024 pm 02:08 PM
Profiling in Java is used to determine the time and resource consumption in application execution. Implement profiling using JavaVisualVM: Connect to the JVM to enable profiling, set the sampling interval, run the application, stop profiling, and the analysis results display a tree view of the execution time. Methods to optimize performance include: identifying hotspot reduction methods and calling optimization algorithms
