

Read the classification model evaluation indicators in one article

Model evaluation is a very important part of deep learning and machine learning, used to measure the performance and effect of the model. This article will break down the confusion matrix, accuracy, precision, recall and F1 score step by step
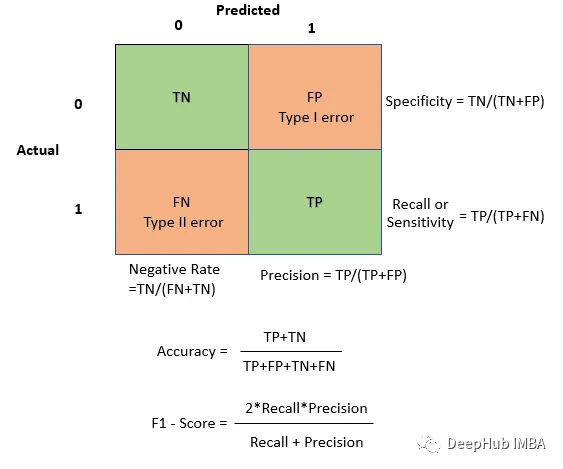
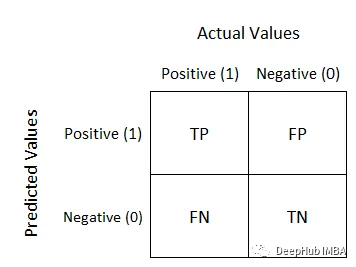
##Confusion Matrix
The confusion matrix is used to evaluate the performance of the model in classification problems. It is a table showing how the model classifies samples. Rows represent actual categories and columns represent predicted categories. For a two-classification problem, the structure of the confusion matrix is as follows:
- True Positive (TP): It is actually a positive example and the model predicts is the number of positive examples and the model's ability to correctly identify positive instances. Higher TP is usually desirable
- False Negative (FN): Number of samples that are actually positive and predicted by the model to be negative, depending on the application this may be critical (for example, failure to detect a security threat).
- False Positive (FP): The number of samples that are actually negative examples and the model predicts positive examples. It emphasizes the situation where the model predicts positive cases when it should not predict positive cases. This May have application-dependent consequences (e.g. unnecessary treatment in medical diagnosis)
- True Negative (TN): Number of samples that are actually negative and predicted by the model to be negative , reflects the model’s ability to correctly identify negative instances. Usually requires a higher TN
from sklearn.metrics import confusion_matrix import seaborn as sns import matplotlib.pyplot as plt # Example predictions and true labels y_true = [1, 0, 1, 1, 0, 1, 0, 0, 1, 0] y_pred = [1, 0, 1, 0, 0, 1, 0, 1, 1, 1] # Create a confusion matrix cm = confusion_matrix(y_true, y_pred) # Visualize the blueprint sns.heatmap(cm, annot=True, fmt="d", cmap="Blues", xticklabels=["Predicted 0", "Predicted 1"], yticklabels=["Actual 0", "Actual 1"]) plt.xlabel("Predicted") plt.ylabel("Actual") plt.show()Use TP and TN when you want to emphasize correct predictions and overall accuracy. Use FP and FN when you want to understand the types of errors your model makes. For example, in applications where the cost of false positives is high, minimizing false positives may be critical.
As an example, let’s talk about spam classifiers. The confusion matrix helps us understand how many spam emails the classifier correctly identified and how many non-spam emails it incorrectly marked as spam
Based on the confusion matrix, many other emails can be calculated Evaluation metrics such as accuracy, precision, recall and F1 score.
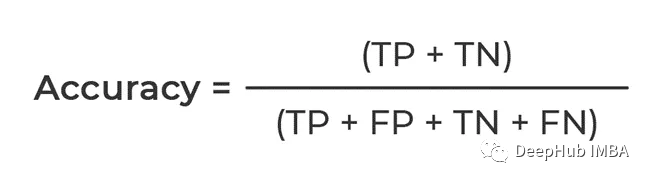
Accuracy
Precision
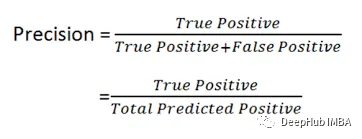 # #You can see the formula. It calculates the proportion of Positive, that is to say, how many Positives in the data are correctly predicted, so Precision is also called the accuracy rate
This becomes important in situations where false positives have significant consequences or costs. Taking the medical diagnosis model as an example, the accuracy is ensured to ensure that only those who really need treatment receive treatment
Recall
Recall rate, also known as recovery rate is the sensitivity or true positive rate, which refers to the model’s ability to capture all positive instances
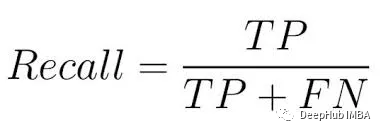 As can be seen from the formula, its main The purpose is to calculate the number of actual positive examples captured by the model, that is, the proportion of positive examples. Therefore, Recall is also called recall rate
F1 Score
The calculation formula of F1 score is: F1 = 2 * (Precision * Recall) / (Precision Recall) Among them, precision refers to the proportion of samples predicted as positive examples by the model that are actually positive examples; recall rate refers to the proportion of the number of samples correctly predicted as positive examples by the model to the number of samples that are actually positive examples. The F1 score is the harmonic mean of precision and recall, which can comprehensively consider the accuracy and comprehensiveness of the model to evaluate the performance of the model
# #F1 score is important because it provides a trade-off between precision and recall. When you want to find a balance between precision and recall, or for general applications, you can use F1 Score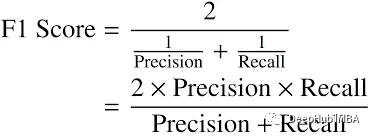
Summary
In this article, we introduced the confusion matrix, accuracy, precision, recall and F1 score in detail, and pointed out that these indicators can effectively evaluate and Improve model performance
The above is the detailed content of Read the classification model evaluation indicators in one article. For more information, please follow other related articles on the PHP Chinese website!

Hot AI Tools

Undresser.AI Undress
AI-powered app for creating realistic nude photos

AI Clothes Remover
Online AI tool for removing clothes from photos.

Undress AI Tool
Undress images for free

Clothoff.io
AI clothes remover

Video Face Swap
Swap faces in any video effortlessly with our completely free AI face swap tool!

Hot Article
Hot Tools

Notepad++7.3.1
Easy-to-use and free code editor

SublimeText3 Chinese version
Chinese version, very easy to use

Zend Studio 13.0.1
Powerful PHP integrated development environment

Dreamweaver CS6
Visual web development tools

SublimeText3 Mac version
God-level code editing software (SublimeText3)
Hot Topics
 1386
1386
 52
52

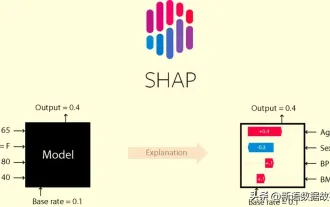 This article will take you to understand SHAP: model explanation for machine learning
Jun 01, 2024 am 10:58 AM
This article will take you to understand SHAP: model explanation for machine learning
Jun 01, 2024 am 10:58 AM
In the fields of machine learning and data science, model interpretability has always been a focus of researchers and practitioners. With the widespread application of complex models such as deep learning and ensemble methods, understanding the model's decision-making process has become particularly important. Explainable AI|XAI helps build trust and confidence in machine learning models by increasing the transparency of the model. Improving model transparency can be achieved through methods such as the widespread use of multiple complex models, as well as the decision-making processes used to explain the models. These methods include feature importance analysis, model prediction interval estimation, local interpretability algorithms, etc. Feature importance analysis can explain the decision-making process of a model by evaluating the degree of influence of the model on the input features. Model prediction interval estimate
 Identify overfitting and underfitting through learning curves
Apr 29, 2024 pm 06:50 PM
Identify overfitting and underfitting through learning curves
Apr 29, 2024 pm 06:50 PM
This article will introduce how to effectively identify overfitting and underfitting in machine learning models through learning curves. Underfitting and overfitting 1. Overfitting If a model is overtrained on the data so that it learns noise from it, then the model is said to be overfitting. An overfitted model learns every example so perfectly that it will misclassify an unseen/new example. For an overfitted model, we will get a perfect/near-perfect training set score and a terrible validation set/test score. Slightly modified: "Cause of overfitting: Use a complex model to solve a simple problem and extract noise from the data. Because a small data set as a training set may not represent the correct representation of all data." 2. Underfitting Heru
 Beyond ORB-SLAM3! SL-SLAM: Low light, severe jitter and weak texture scenes are all handled
May 30, 2024 am 09:35 AM
Beyond ORB-SLAM3! SL-SLAM: Low light, severe jitter and weak texture scenes are all handled
May 30, 2024 am 09:35 AM
Written previously, today we discuss how deep learning technology can improve the performance of vision-based SLAM (simultaneous localization and mapping) in complex environments. By combining deep feature extraction and depth matching methods, here we introduce a versatile hybrid visual SLAM system designed to improve adaptation in challenging scenarios such as low-light conditions, dynamic lighting, weakly textured areas, and severe jitter. sex. Our system supports multiple modes, including extended monocular, stereo, monocular-inertial, and stereo-inertial configurations. In addition, it also analyzes how to combine visual SLAM with deep learning methods to inspire other research. Through extensive experiments on public datasets and self-sampled data, we demonstrate the superiority of SL-SLAM in terms of positioning accuracy and tracking robustness.
 The evolution of artificial intelligence in space exploration and human settlement engineering
Apr 29, 2024 pm 03:25 PM
The evolution of artificial intelligence in space exploration and human settlement engineering
Apr 29, 2024 pm 03:25 PM
In the 1950s, artificial intelligence (AI) was born. That's when researchers discovered that machines could perform human-like tasks, such as thinking. Later, in the 1960s, the U.S. Department of Defense funded artificial intelligence and established laboratories for further development. Researchers are finding applications for artificial intelligence in many areas, such as space exploration and survival in extreme environments. Space exploration is the study of the universe, which covers the entire universe beyond the earth. Space is classified as an extreme environment because its conditions are different from those on Earth. To survive in space, many factors must be considered and precautions must be taken. Scientists and researchers believe that exploring space and understanding the current state of everything can help understand how the universe works and prepare for potential environmental crises
 Implementing Machine Learning Algorithms in C++: Common Challenges and Solutions
Jun 03, 2024 pm 01:25 PM
Implementing Machine Learning Algorithms in C++: Common Challenges and Solutions
Jun 03, 2024 pm 01:25 PM
Common challenges faced by machine learning algorithms in C++ include memory management, multi-threading, performance optimization, and maintainability. Solutions include using smart pointers, modern threading libraries, SIMD instructions and third-party libraries, as well as following coding style guidelines and using automation tools. Practical cases show how to use the Eigen library to implement linear regression algorithms, effectively manage memory and use high-performance matrix operations.
 Five schools of machine learning you don't know about
Jun 05, 2024 pm 08:51 PM
Five schools of machine learning you don't know about
Jun 05, 2024 pm 08:51 PM
Machine learning is an important branch of artificial intelligence that gives computers the ability to learn from data and improve their capabilities without being explicitly programmed. Machine learning has a wide range of applications in various fields, from image recognition and natural language processing to recommendation systems and fraud detection, and it is changing the way we live. There are many different methods and theories in the field of machine learning, among which the five most influential methods are called the "Five Schools of Machine Learning". The five major schools are the symbolic school, the connectionist school, the evolutionary school, the Bayesian school and the analogy school. 1. Symbolism, also known as symbolism, emphasizes the use of symbols for logical reasoning and expression of knowledge. This school of thought believes that learning is a process of reverse deduction, through existing
 Explainable AI: Explaining complex AI/ML models
Jun 03, 2024 pm 10:08 PM
Explainable AI: Explaining complex AI/ML models
Jun 03, 2024 pm 10:08 PM
Translator | Reviewed by Li Rui | Chonglou Artificial intelligence (AI) and machine learning (ML) models are becoming increasingly complex today, and the output produced by these models is a black box – unable to be explained to stakeholders. Explainable AI (XAI) aims to solve this problem by enabling stakeholders to understand how these models work, ensuring they understand how these models actually make decisions, and ensuring transparency in AI systems, Trust and accountability to address this issue. This article explores various explainable artificial intelligence (XAI) techniques to illustrate their underlying principles. Several reasons why explainable AI is crucial Trust and transparency: For AI systems to be widely accepted and trusted, users need to understand how decisions are made
 Is Flash Attention stable? Meta and Harvard found that their model weight deviations fluctuated by orders of magnitude
May 30, 2024 pm 01:24 PM
Is Flash Attention stable? Meta and Harvard found that their model weight deviations fluctuated by orders of magnitude
May 30, 2024 pm 01:24 PM
MetaFAIR teamed up with Harvard to provide a new research framework for optimizing the data bias generated when large-scale machine learning is performed. It is known that the training of large language models often takes months and uses hundreds or even thousands of GPUs. Taking the LLaMA270B model as an example, its training requires a total of 1,720,320 GPU hours. Training large models presents unique systemic challenges due to the scale and complexity of these workloads. Recently, many institutions have reported instability in the training process when training SOTA generative AI models. They usually appear in the form of loss spikes. For example, Google's PaLM model experienced up to 20 loss spikes during the training process. Numerical bias is the root cause of this training inaccuracy,
