
 Web Front-end
H5 Tutorial
html5 Canvas drawing tutorial (8)—bezierCurveTo method for drawing curves in canvas_html5 tutorial skills
Web Front-end
H5 Tutorial
html5 Canvas drawing tutorial (8)—bezierCurveTo method for drawing curves in canvas_html5 tutorial skills
html5 Canvas drawing tutorial (8)—bezierCurveTo method for drawing curves in canvas_html5 tutorial skills

In the previous article, I have talked about three methods of drawing curves in canvas: arc, arcTo and quadraticCurveTo. They all have one thing in common, that is, they The curves you draw can only go to one side. The biggest difference between the bezierCurveTo we are talking about today and them is that it has two control points, which means you can draw an S-shaped curve.
bezierCurveTo, also known as Bezier curve, if you have learned certain drawing tools, you can understand it immediately.
The syntax of bezierCurveTo is as follows:
ctx.bezierCurveTo(x1,y1,x2,y2,x,y); I will explain its parameters as usual, (x1,y1) is The coordinates of control point 1, (x2, y2) are the coordinates of control point 2, and (x, y) are the coordinates of its end point. Like quadraticCurveTo, its starting point coordinates are also preset by moveTo.
So, bezierCurveTo needs 4 points to draw a curve: starting point, end point, control point 1, control point 2. For the purpose of subsequent explanation, here I assume that control point 1 corresponds to the starting point, and control point 2 corresponds to the end point
Here we have to mention the old problem of canvas drawing again, that is, the code drawing is all based on guessing, and you have to refresh to know where to draw.
I will continue the good tradition from before and draw some auxiliary lines to help everyone understand:
var x1=450, //x coordinate of control point 1
y1 = 300, //y of control point 1
x2 = 450, // x of control point 2
y2 = 500, // y of control point 2
x = 300, // end point x
y = 500; // end point y
ctx.moveTo(300,300) ;//Starting point
ctx.beginPath();
ctx.lineWidth = 5;
ctx.strokeStyle = "rgba(0,0,0,1)"
ctx.moveTo(300,300) ;
ctx.bezierCurveTo(x1,y1,x2,y2,x,y);
ctx.stroke();
//Start drawing auxiliary lines
ctx.beginPath();
ctx.strokeStyle = "rgba(255,0,0,0.5)";
ctx.lineWidth = 1;
// Connect the starting point and control point 1
ctx.moveTo(300,300);
ctx.lineTo(x1,y1);
// Connect the end point and control point 2
ctx.moveTo(x2,y2);
ctx.lineTo(x,y);
// Connect the starting point and end point (baseline)
ctx.moveTo(300,300);
ctx.lineTo(x,y);
ctx.stroke();
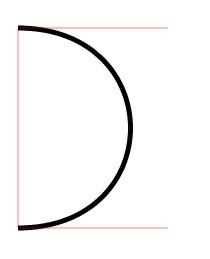
Here we first draw a curve similar to quadraticCurveTo, only leaning to one side. This line appears "smooth" because the x-coordinates of control points 1 and 2 are the same.
Now draw another S-shaped curve to prove that bezierCurveTo is different:
var x1 = 150;
...
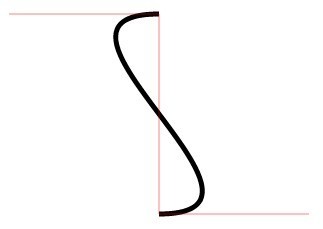
In fact, just change the coordinates of control point 1. If the coordinates of control point 1 and control point 2 are on both sides of the baseline, an S-shaped curve will be drawn; if they are both on one side of the baseline, it will have an effect similar to quadraticCurveTo.
The situation in this example is relatively simple. The baseline line (from the starting point to the end point) is vertical. However, in practical applications, most of the time our baseline is slanted, and the situation is much more complicated. But try it yourself
Each drawing method seems to have a relatively single function, but powerful methods are the combination of individual methods. In subsequent articles, I will try to explain how to draw some conventional graphics, such as rounded rectangles and ellipses. They require a combination of these previous single methods.

Hot AI Tools

Undresser.AI Undress
AI-powered app for creating realistic nude photos

AI Clothes Remover
Online AI tool for removing clothes from photos.

Undress AI Tool
Undress images for free

Clothoff.io
AI clothes remover

Video Face Swap
Swap faces in any video effortlessly with our completely free AI face swap tool!

Hot Article
Hot Tools

Notepad++7.3.1
Easy-to-use and free code editor

SublimeText3 Chinese version
Chinese version, very easy to use

Zend Studio 13.0.1
Powerful PHP integrated development environment

Dreamweaver CS6
Visual web development tools

SublimeText3 Mac version
God-level code editing software (SublimeText3)
Hot Topics
 1392
1392
 52
52

 Which schools use canvas?
Aug 18, 2023 pm 05:59 PM
Which schools use canvas?
Aug 18, 2023 pm 05:59 PM
Schools using canvas include Stanford University, MIT, Columbia University, University of California, Berkeley, etc. Detailed introduction: 1. Stanford University uses Canvas as its main online learning platform. Teachers and students at Stanford University use Canvas to manage and communicate course content, and learn through functions such as online discussions, assignment submissions, and exams; 2. Ma Provincial Polytechnic Institute and MIT also use Canvas as their online learning management system and conduct course management through the Canvas platform; 3. Columbia University, etc.
 What are the canvas arrow plug-ins?
Aug 21, 2023 pm 02:14 PM
What are the canvas arrow plug-ins?
Aug 21, 2023 pm 02:14 PM
The canvas arrow plug-ins include: 1. Fabric.js, which has a simple and easy-to-use API and can create custom arrow effects; 2. Konva.js, which provides the function of drawing arrows and can create various arrow styles; 3. Pixi.js , which provides rich graphics processing functions and can achieve various arrow effects; 4. Two.js, which can easily create and control arrow styles and animations; 5. Arrow.js, which can create various arrow effects; 6. Rough .js, you can create hand-drawn arrows, etc.
 What are the details of the canvas clock?
Aug 21, 2023 pm 05:07 PM
What are the details of the canvas clock?
Aug 21, 2023 pm 05:07 PM
The details of the canvas clock include clock appearance, tick marks, digital clock, hour, minute and second hands, center point, animation effects, other styles, etc. Detailed introduction: 1. Clock appearance, you can use Canvas to draw a circular dial as the appearance of the clock, and you can set the size, color, border and other styles of the dial; 2. Scale lines, draw scale lines on the dial to represent hours or minutes. Position; 3. Digital clock, you can draw a digital clock on the dial to indicate the current hour and minute; 4. Hour hand, minute hand, second hand, etc.
 Learn the canvas framework and explain the commonly used canvas framework in detail
Jan 17, 2024 am 11:03 AM
Learn the canvas framework and explain the commonly used canvas framework in detail
Jan 17, 2024 am 11:03 AM
Explore the Canvas framework: To understand what are the commonly used Canvas frameworks, specific code examples are required. Introduction: Canvas is a drawing API provided in HTML5, through which we can achieve rich graphics and animation effects. In order to improve the efficiency and convenience of drawing, many developers have developed different Canvas frameworks. This article will introduce some commonly used Canvas frameworks and provide specific code examples to help readers gain a deeper understanding of how to use these frameworks. 1. EaselJS framework Ea
 What versions of html2canvas are there?
Aug 22, 2023 pm 05:58 PM
What versions of html2canvas are there?
Aug 22, 2023 pm 05:58 PM
The versions of html2canvas include html2canvas v0.x, html2canvas v1.x, etc. Detailed introduction: 1. html2canvas v0.x, which is an early version of html2canvas. The latest stable version is v0.5.0-alpha1. It is a mature version that has been widely used and verified in many projects; 2. html2canvas v1.x, this is a new version of html2canvas.
 uniapp implements how to use canvas to draw charts and animation effects
Oct 18, 2023 am 10:42 AM
uniapp implements how to use canvas to draw charts and animation effects
Oct 18, 2023 am 10:42 AM
How to use canvas to draw charts and animation effects in uniapp requires specific code examples 1. Introduction With the popularity of mobile devices, more and more applications need to display various charts and animation effects on the mobile terminal. As a cross-platform development framework based on Vue.js, uniapp provides the ability to use canvas to draw charts and animation effects. This article will introduce how uniapp uses canvas to achieve chart and animation effects, and give specific code examples. 2. canvas
 What properties does tkinter canvas have?
Aug 21, 2023 pm 05:46 PM
What properties does tkinter canvas have?
Aug 21, 2023 pm 05:46 PM
The tkinter canvas attributes include bg, bd, relief, width, height, cursor, highlightbackground, highlightcolor, highlightthickness, insertbackground, insertwidth, selectbackground, selectforeground, xscrollcommand attributes, etc. Detailed introduction
 Explore the powerful role and application of canvas in game development
Jan 17, 2024 am 11:00 AM
Explore the powerful role and application of canvas in game development
Jan 17, 2024 am 11:00 AM
Understand the power and application of canvas in game development Overview: With the rapid development of Internet technology, web games are becoming more and more popular among players. As an important part of web game development, canvas technology has gradually emerged in game development, showing its powerful power and application. This article will introduce the potential of canvas in game development and demonstrate its application through specific code examples. 1. Introduction to canvas technology Canvas is a new element in HTML5, which allows us to use
