
 Web Front-end
H5 Tutorial
html5 Canvas drawing tutorial (4)—Unclosed paths and gradient filling methods_html5 tutorial skills
Web Front-end
H5 Tutorial
html5 Canvas drawing tutorial (4)—Unclosed paths and gradient filling methods_html5 tutorial skills
html5 Canvas drawing tutorial (4)—Unclosed paths and gradient filling methods_html5 tutorial skills

There are generally two ways of drawing, namely filling and stroking. The previous article has already talked about the stroke method. This article will talk about the method of filling graphics in Canvas.
Filling is fill(), very straightforward, right? And just like strokeStyle represents the stroke style, fillStyle represents the fill style.
ctx.fillStyle = 'Color'; The default fill style is opaque black
Question: Can unclosed paths be filled?
Yes. The Canvas will connect directly from the end point of your current path to the start point and then fill it. As shown in the picture:
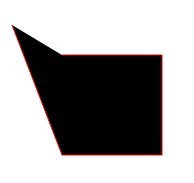
But you can find that the last paragraph is not stroked.
Remember that in our previous article we drew a square with 4 lines, but canvas is not so bad, and it doesn’t even have a function to draw a rectangle directly. You can use fillRect() to directly fill a rectangle:
ctx.fillRect(x,y,width,height);
The x and y here refer to the coordinates of the starting point of the upper left corner of the rectangle, remember.
When it comes to fillRect, we have to mention strokeRect. You guessed it, it means to directly stroke a rectangle.
There are also fillText and strokeText. As for their functions, you may have guessed them. I won’t go into them here. Let’s preview them first.
Canvas fill gradient color
In Canvas, gradient color is also divided into two types, namely linear gradient and radial gradient, and the methods of creating them are also independent. Let's first look at how to create a linear gradient.
Create Linear Gradient = createLinearGradient - See, still a very straightforward word. His syntax is as follows:
createLinearGradient(x1,y1,x2,y2) has 4 parameters! It seems so complicated, but in fact this is quite simple, because as we have said before, a point in the flat world is determined by the x coordinate and y coordinate. Therefore, x1 and y1 represent the starting point coordinates of the linear gradient, and x2 and y2 represent the end point coordinates.
The advantage of this is obvious. It is very convenient if we want to create a diagonal linear gradient. But let's try creating a horizontal linear gradient first.
var linear = ctx.createLinearGradient(100,100,200,100); The gradient seems to be created, so can we fill it? ————This gradient is empty and has no color.
The way to add color to the gradient bar is addColorStop (position, color). But please note that this addColorStop is not added to the brush, but to the previous variable that holds the gradient. Here I am linear.
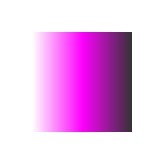
var linear = ctx.createLinearGradient(100,100,200,100);
linear.addColorStop(0,'#fff');
linear.addColorStop(0.5,'#f0f');
linear.addColorStop(1,'#333');
I used 3 addColorStops here, which means adding 3 colors to the gradient bar.
Note: The position parameter of addColorStop is always a number between 0-1, which can be two decimal places, indicating a percentage. He cannot receive parameters like '3px'.
At this time, we can fill the gradient color, but we must first assign the defined gradient to fillStyle.
var linear = ctx.createLinearGradient(100,100,200,100);
linear.addColorStop(0,'#fff');
linear.addColorStop( 0.5,'#f0f');
linear.addColorStop(1,'#333');
ctx.fillStyle = linear; //Assign the gradient to the fill style
ctx.fillRect(100,100,100,100);
ctx.stroke();
Note that fillRect and strokeRect draw independent paths. As shown in the above code, calling stroke after fillRect will not stroke the rectangle just drawn. The same is true for strokeRect.
After testing, I discovered a very annoying problem, that is, the coordinates of the linear gradient are relative to the entire Canvas range. For example, here, the starting point of my linear gradient is 100,100. If I draw a rectangle at 0,0 and fill it with this gradient, I will find that there is no filling - because the range of my gradient simply exceeds the rectangle. scope.
This is really a cheating setting.
Question: Will the color be filled before the starting point of the gradient and after the ending point of the gradient?
Yes. The color before the starting point is the starting color, and the color after the end point is always the end color.
How to terminate the end color, you can fill in a transparent end color after the end color. For example:
linear.addColorStop(0.99,' #333');
linear.addColorStop(1,'rgba(51,51,51,0)');
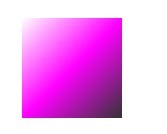
According to the previous plan, I will build a tilted linear gradient to try try. Just change the parameters of createLinearGradient.
var linear = ctx.createLinearGradient(100,100,200,200);
The effect is as follows:
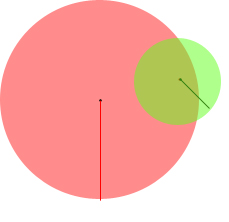
createRadialGradient(x1,y1,r1,x2,y2,r2) where x1,y1,x2,y2 are still the same Represents the starting point and end point, but the starting point and end point here are both a circle, and x, y are the coordinates of the center of the circle. Therefore, r1 and r2 are the radius of the starting circle and the radius of the end circle respectively. As shown in the picture:
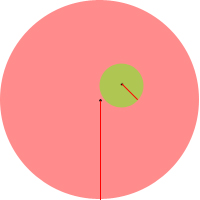
In my impression, it seems that the radial gradient is a circle, the center of the circle is the starting point, and the radius of the circle is the end point. But the radial gradient in the canvas is actually different. The starting point is a circle and the end point is a circle, which is different from my understanding.
We start from the simplest. First, make a very regular radial gradient, that is, the center of the gradient circle is the starting point of the gradient. Because of the regular radial gradient, the center is the center of the circle, so we should try to avoid deflection. So, let’s make the center of the end circle coincide with the center of the starting circle, right?
var radial = ctx.createRadialGradient(55, 55,10,55,55,55); //Coincident circle center coordinates
radial.addColorStop(0,'#fff');
radial.addColorStop(0.5,'#ff0');
radial.addColorStop(0.9,'#555');
radial.addColorStop(1,'#f00');
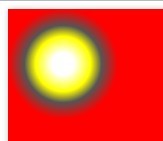
Here I set the center coordinates of the radial gradient start circle and the end circle to be the same, and the radius of the start circle is 10, and the radius of the end circle is 55. The final radial gradient range drawn is a circle with a width and height of 110, Note that the gradient range is based on the range of the end point circle.
(You can see that there is still a color outside the range of the end circle. This color is the end color. However, if you try to use radial.addColorStop(1.5,'#0f0′); to define a color outside the gradient range, You will still get an error).
So, what is the use of the radius of the starting circle? ——The center of the normal radial gradient (let’s call it “change center”...) is just a point and should not be a circle. In fact, we are right. This starting point circle is equivalent to a dot, but it may be larger.
Let us make the radius of the starting circle very large, close to the radius of the end circle:
var radial = ctx.createRadialGradient(55,55,50,55,55,55); //very close
Other colorStops remain unchanged, and then the graphic becomes like this.
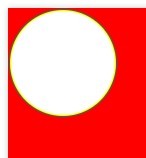
In other words, the starting color of the radial gradient in the canvas is drawn from outside the range of the starting circle, and the entire color of the starting circle is the starting color.
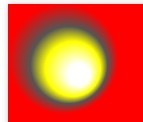
We set the radius of the starting circle to 0, and the "change center" of the radial gradient is really a point.
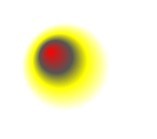
Most of the time we don’t need a very formal radial gradient. Instead, we want its center of change to be offset, similar to the picture below:
var radial = ctx.createRadialGradient(75,75, 0,55,55,55); but the gradient range at this time is still the range of the end point circle.
Many people are born with a destructive mentality. For example, here, the radius of the end circle is always larger than the starting circle, but what would happen if they were reversed?
var radial = ctx.createRadialGradient(75, 75,55,55,55,0);
After testing, this will not report an error, but the original gradient from inside to outside has been changed into a gradient from outside to inside. This is a good use.
There is another problem. If we offset the center of the starting circle and the range of the starting circle exceeds the range of the ending circle,
What will happen at this time?
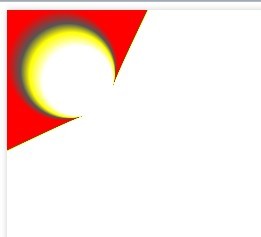
Ah! ? What is going on? !
This happens when the starting point circle and the ending point circle only partially overlap. So, if you want a normal radial gradient, make sure one circle completely wraps the other.
In addition, since the gradient can be assigned to fillStyle, it can also be assigned to strokeStyle. You know the effect.

Hot AI Tools

Undresser.AI Undress
AI-powered app for creating realistic nude photos

AI Clothes Remover
Online AI tool for removing clothes from photos.

Undress AI Tool
Undress images for free

Clothoff.io
AI clothes remover

AI Hentai Generator
Generate AI Hentai for free.

Hot Article
Hot Tools

Notepad++7.3.1
Easy-to-use and free code editor

SublimeText3 Chinese version
Chinese version, very easy to use

Zend Studio 13.0.1
Powerful PHP integrated development environment

Dreamweaver CS6
Visual web development tools

SublimeText3 Mac version
God-level code editing software (SublimeText3)
Hot Topics
 1374
1374
 52
52

 Which schools use canvas?
Aug 18, 2023 pm 05:59 PM
Which schools use canvas?
Aug 18, 2023 pm 05:59 PM
Schools using canvas include Stanford University, MIT, Columbia University, University of California, Berkeley, etc. Detailed introduction: 1. Stanford University uses Canvas as its main online learning platform. Teachers and students at Stanford University use Canvas to manage and communicate course content, and learn through functions such as online discussions, assignment submissions, and exams; 2. Ma Provincial Polytechnic Institute and MIT also use Canvas as their online learning management system and conduct course management through the Canvas platform; 3. Columbia University, etc.
 Operation process of creating gradient color three-dimensional cylinder in PPT
Mar 26, 2024 pm 04:21 PM
Operation process of creating gradient color three-dimensional cylinder in PPT
Mar 26, 2024 pm 04:21 PM
1. Open PPT and enter its main interface. 2. Delete the two input boxes of Click here to add title and subtitle. 3. Click the Insert menu and select the Shape tool. 4. Find and click on the cylinder in the basic shape to draw a cylinder. 5. Click Format and select Shape Fill. 6. Click on the gradient and click on other gradients in the drop-down menu that opens. 7. Select Gradient Fill, click on the long yellow sand in the preset color, and click Close. 8. We have created a long yellow sand gradient cylinder in PPT.
 What are the canvas arrow plug-ins?
Aug 21, 2023 pm 02:14 PM
What are the canvas arrow plug-ins?
Aug 21, 2023 pm 02:14 PM
The canvas arrow plug-ins include: 1. Fabric.js, which has a simple and easy-to-use API and can create custom arrow effects; 2. Konva.js, which provides the function of drawing arrows and can create various arrow styles; 3. Pixi.js , which provides rich graphics processing functions and can achieve various arrow effects; 4. Two.js, which can easily create and control arrow styles and animations; 5. Arrow.js, which can create various arrow effects; 6. Rough .js, you can create hand-drawn arrows, etc.
 What versions of html2canvas are there?
Aug 22, 2023 pm 05:58 PM
What versions of html2canvas are there?
Aug 22, 2023 pm 05:58 PM
The versions of html2canvas include html2canvas v0.x, html2canvas v1.x, etc. Detailed introduction: 1. html2canvas v0.x, which is an early version of html2canvas. The latest stable version is v0.5.0-alpha1. It is a mature version that has been widely used and verified in many projects; 2. html2canvas v1.x, this is a new version of html2canvas.
 What are the details of the canvas clock?
Aug 21, 2023 pm 05:07 PM
What are the details of the canvas clock?
Aug 21, 2023 pm 05:07 PM
The details of the canvas clock include clock appearance, tick marks, digital clock, hour, minute and second hands, center point, animation effects, other styles, etc. Detailed introduction: 1. Clock appearance, you can use Canvas to draw a circular dial as the appearance of the clock, and you can set the size, color, border and other styles of the dial; 2. Scale lines, draw scale lines on the dial to represent hours or minutes. Position; 3. Digital clock, you can draw a digital clock on the dial to indicate the current hour and minute; 4. Hour hand, minute hand, second hand, etc.
 What properties does tkinter canvas have?
Aug 21, 2023 pm 05:46 PM
What properties does tkinter canvas have?
Aug 21, 2023 pm 05:46 PM
The tkinter canvas attributes include bg, bd, relief, width, height, cursor, highlightbackground, highlightcolor, highlightthickness, insertbackground, insertwidth, selectbackground, selectforeground, xscrollcommand attributes, etc. Detailed introduction
 uniapp implements how to use canvas to draw charts and animation effects
Oct 18, 2023 am 10:42 AM
uniapp implements how to use canvas to draw charts and animation effects
Oct 18, 2023 am 10:42 AM
How to use canvas to draw charts and animation effects in uniapp requires specific code examples 1. Introduction With the popularity of mobile devices, more and more applications need to display various charts and animation effects on the mobile terminal. As a cross-platform development framework based on Vue.js, uniapp provides the ability to use canvas to draw charts and animation effects. This article will introduce how uniapp uses canvas to achieve chart and animation effects, and give specific code examples. 2. canvas
 Learn the canvas framework and explain the commonly used canvas framework in detail
Jan 17, 2024 am 11:03 AM
Learn the canvas framework and explain the commonly used canvas framework in detail
Jan 17, 2024 am 11:03 AM
Explore the Canvas framework: To understand what are the commonly used Canvas frameworks, specific code examples are required. Introduction: Canvas is a drawing API provided in HTML5, through which we can achieve rich graphics and animation effects. In order to improve the efficiency and convenience of drawing, many developers have developed different Canvas frameworks. This article will introduce some commonly used Canvas frameworks and provide specific code examples to help readers gain a deeper understanding of how to use these frameworks. 1. EaselJS framework Ea
