Learn how to use OriginPro8 for curve fitting
originpro8 is a graphic visualization and data analysis software developed by Origin Lab in the United States. The software focuses on data analysis and drawing. Data analysis mainly includes various complete mathematical analysis functions such as statistics, signal processing, image processing, peak analysis and curve fitting. It is very It is powerful, but many novice friends may not know how originpro8 fits curves, so if you don’t know, let’s take a look!
How to fit the curve with originpro8
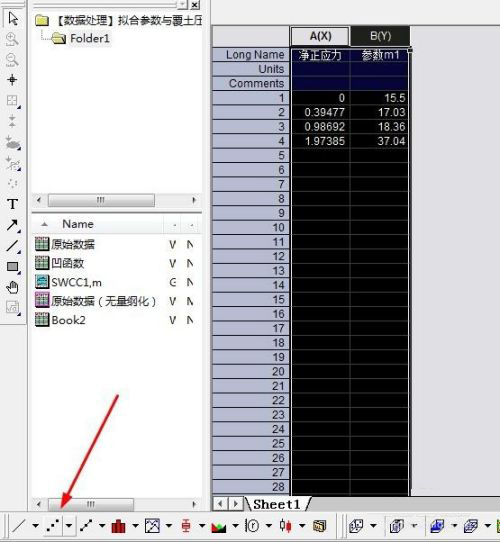
1. Select the data and click on the icon pointed by the arrow in the figure to generate a scatter plot.Note: You must select the data first before you can generate a graph!
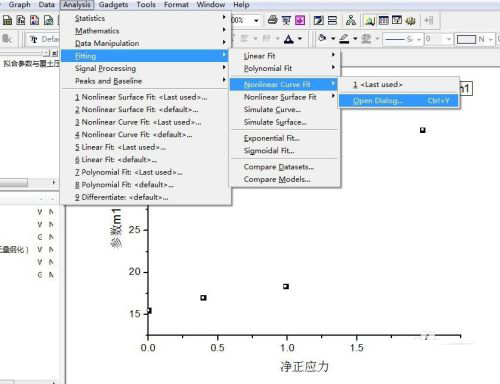
2. Select the points in the scatter plot and click Analysis - Fitting - Nonlinear Curve Fit - Open Dialog on the toolbar to open the curve fitting dialog box.
Note: Be sure to select the points in the scatter plot first, and then click on the toolbar!
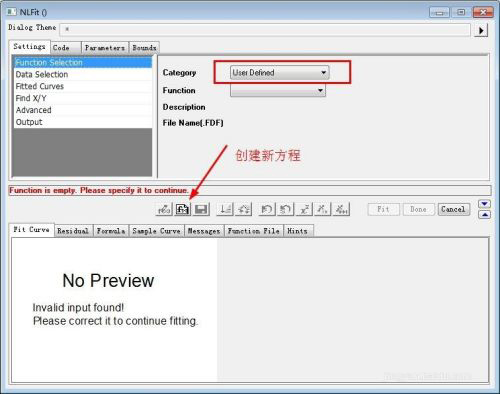
3. In the dialog box, select "User Defined" for the Category option, and then click the button pointed by the arrow to open the dialog box for creating a new equation.
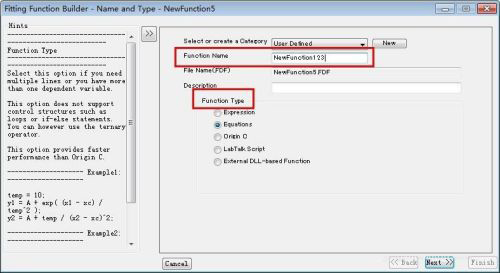
In the dialog box: the Function Name column allows you to name the equation (English only), this time it is named "NewFunction123"; in the Function Type column, select the second "Equations", and then click next to proceed to the next step.
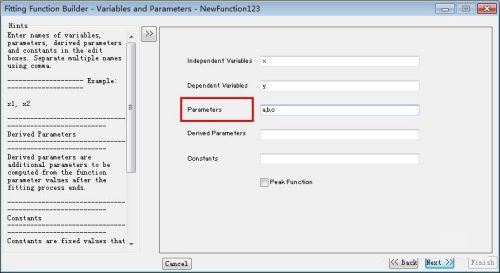
4. Enter the parameter settings. The first and second lines are the independent variable x and the dependent variable y. The third line is the equation parameters you need to set. Take the quadratic equation of one variable as an example. Set Parameters a, b, c (letters and punctuation marks must be in English input method), then click next to proceed to the next step.
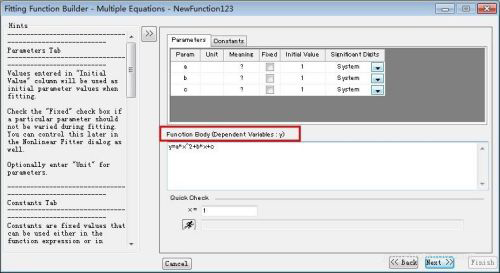
5. Enter the equation input, as shown in the figure, enter the quadratic equation in the red line box. (Letters and symbols must be in English input method).
The basic settings have been completed here, just keep clicking next, and finally click finish!
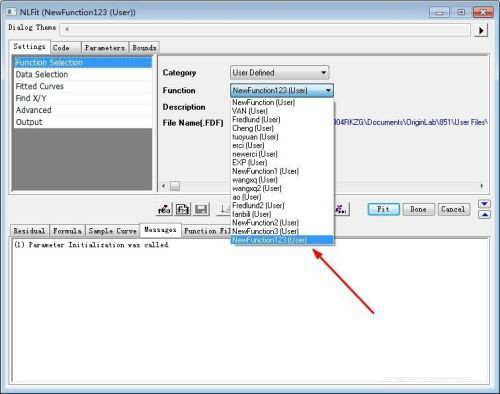
6. Return to the initial curve fitting dialog box, and you will find that the created equation NewFunction123 has been created in the drop-down menu of the Function column.
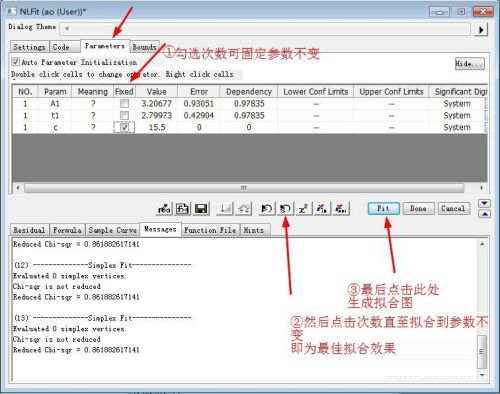
7. Then click the "Parameters" tab and check Fixed to fix the parameters; then click the button in step 2 of the figure to perform fitting until the parameters remain unchanged and the desired value is reached. to achieve the best results; finally click Fit to generate the fitting results.
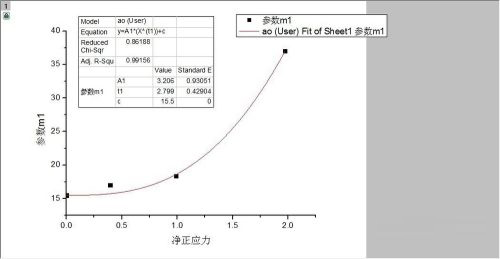
8. The final generated graph is as shown below. The correlation coefficient, goodness-of-fit determination coefficient R-square and the values of each parameter will be displayed in the table.
The above is the detailed content of Learn how to use OriginPro8 for curve fitting. For more information, please follow other related articles on the PHP Chinese website!

Hot AI Tools

Undresser.AI Undress
AI-powered app for creating realistic nude photos

AI Clothes Remover
Online AI tool for removing clothes from photos.

Undress AI Tool
Undress images for free

Clothoff.io
AI clothes remover

AI Hentai Generator
Generate AI Hentai for free.

Hot Article

Hot Tools

Notepad++7.3.1
Easy-to-use and free code editor

SublimeText3 Chinese version
Chinese version, very easy to use

Zend Studio 13.0.1
Powerful PHP integrated development environment

Dreamweaver CS6
Visual web development tools

SublimeText3 Mac version
God-level code editing software (SublimeText3)

Hot Topics
 1378
1378
 52
52
 Completely Uninstall Xiaomi Game Center: No Leftovers!
Mar 18, 2025 pm 06:00 PM
The article details steps to completely uninstall Xiaomi Game Center, remove residual files, prevent auto-reinstallation, and verify the app's removal from a device.
 How to Remove Xiaomi Game Center: Complete Uninstall Guide
Mar 18, 2025 pm 05:58 PM
Article details steps to completely uninstall Xiaomi Game Center from Xiaomi devices, discussing performance benefits and risks involved in the process.Character count: 159
 The Fastest Way to Uninstall Xiaomi Game Center (2025)
Mar 18, 2025 pm 06:03 PM
Article discusses the fastest way to uninstall Xiaomi Game Center in 2025 using built-in settings, with optional third-party tools for efficiency.Character count: 159
 How to Uninstall Xiaomi Game Center
Mar 18, 2025 pm 06:01 PM
The article provides a detailed guide on uninstalling Xiaomi Game Center, discussing standard and alternative methods, and potential performance improvements post-uninstallation.
 Xiaomi Game Center Stuck? Here's How to Uninstall It!
Mar 18, 2025 pm 06:01 PM
Article discusses uninstalling stuck Xiaomi Game Center, troubleshooting, and exploring gaming alternatives. Main issue is app malfunction and removal.
 Xiaomi Game Center Uninstall: Boost Phone Speed in Minutes!
Mar 18, 2025 pm 06:04 PM
The article provides a detailed guide on completely removing Xiaomi Game Center from Xiaomi devices, including uninstallation steps, disabling system integration, clearing residual data, and rebooting. It also discusses performance optimization post-
 Xiaomi Game Center Uninstall: The ULTIMATE Removal Guide
Mar 18, 2025 pm 05:59 PM
This guide addresses uninstalling Xiaomi Game Center, focusing on common issues post-uninstallation, ensuring complete removal of residual files, and preventing automatic reinstallation.
 'LikeTones' Is a Guitar Tuner With No Ads or Upsells
Mar 22, 2025 am 10:16 AM
I've been trying to get back into playing guitar and I've noticed one thing: Both the App Store and Google Play are replete with guitar-tuning apps that are full of either upsells or advertisements. Isn't there any application that helps tune you


