
 Technology peripherals
AI
Application of cause-and-effect correction method in Ant Marketing recommendation scenario
Technology peripherals
AI
Application of cause-and-effect correction method in Ant Marketing recommendation scenario
Application of cause-and-effect correction method in Ant Marketing recommendation scenario

1. Background of cause-and-effect correction
1. Generation of deviation
In the recommendation system, data is collected to Train recommendation models to recommend appropriate items to users. When users interact with recommended items, the data collected is used to further train the model, forming a closed loop. However, there may be various influencing factors in this closed loop, resulting in errors. The main reason for the error is that most of the data used to train the model is observation data rather than ideal training data, which is affected by factors such as exposure strategy and user selection. The essence of this bias lies in the difference between the expectations of empirical risk estimates and the expectations of true ideal risk estimates.

2. Common deviations
The more common deviations in the recommended marketing system mainly include the following three Species:
- Selectivity bias: It is caused by users actively choosing interactive items based on their own preferences.
- Exposure bias: Recommended items are usually only a subset of the overall item candidate pool. Users can only interact with the items recommended by the system when selecting. This leads to bias in the observation data.
- Popularity bias: Some popular items account for a high proportion in the training data, causing the model to learn this performance and recommend more popular items. , causing the Matthew effect.
#There are other deviations, such as position deviation, consistency deviation, etc.
3. Cause and Effect Correction
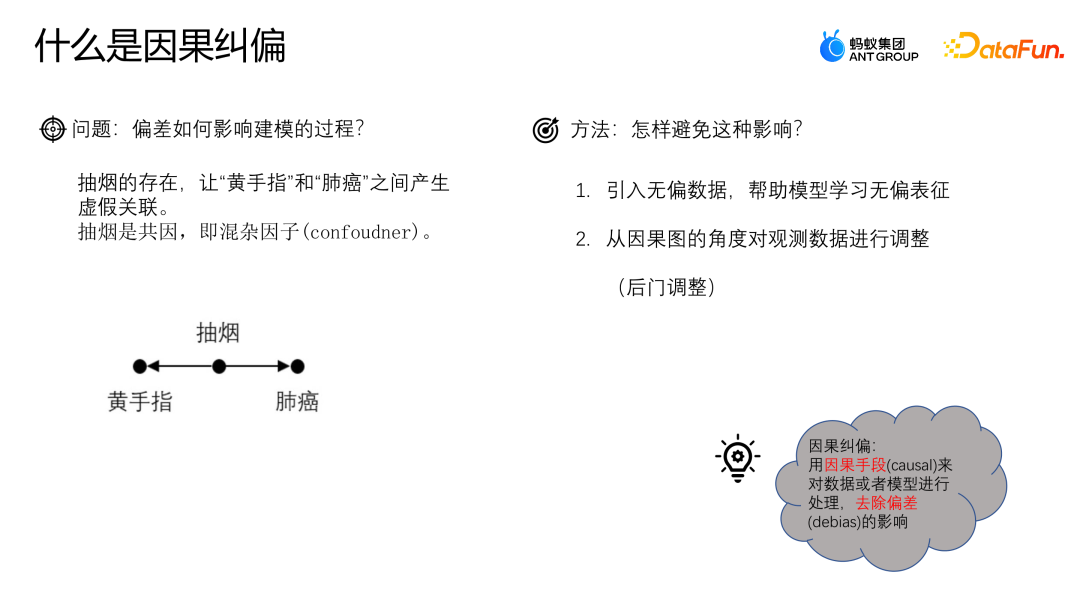
Let’s use an example to understand the deviation. Impact on the modeling process. Suppose we want to study the relationship between coffee drinking and heart disease. We found that coffee drinkers are more likely to develop heart disease, so it may be concluded that there is a direct causal relationship between coffee drinking and heart disease. However, we need to be aware of the presence of confounding factors. For example, suppose coffee drinkers are more likely to also be smokers. Smoking itself is linked to heart disease. Therefore, we cannot simply attribute the relationship between coffee drinking and heart disease to causation, but may be due to the presence of smoking as a confounding factor. To more accurately study the relationship between coffee drinking and heart disease, we need to control for the effects of smoking. One approach is to conduct matched studies, in which smokers are paired with non-smokers and then compared for the relationship between coffee drinking and heart disease. This eliminates the confounding effect of smoking on the results. Causality is a question of what if, that is, if other conditions remain unchanged, will a change in coffee drinking lead to a change in the occurrence of heart disease. Only after controlling for the effects of confounding factors can we more accurately determine whether there is a causal relationship between coffee drinking and heart disease.
How to avoid this problem? One of the more common methods is to introduce unbiased data and use unbiased data to help the model learn unbiased representations; the other is The method is to start from the perspective of a cause-and-effect diagram and correct the deviation by adjusting the observation data later. Causal correction is to process data or models through causal means to remove the influence of bias.
4. Cause-and-effect diagram
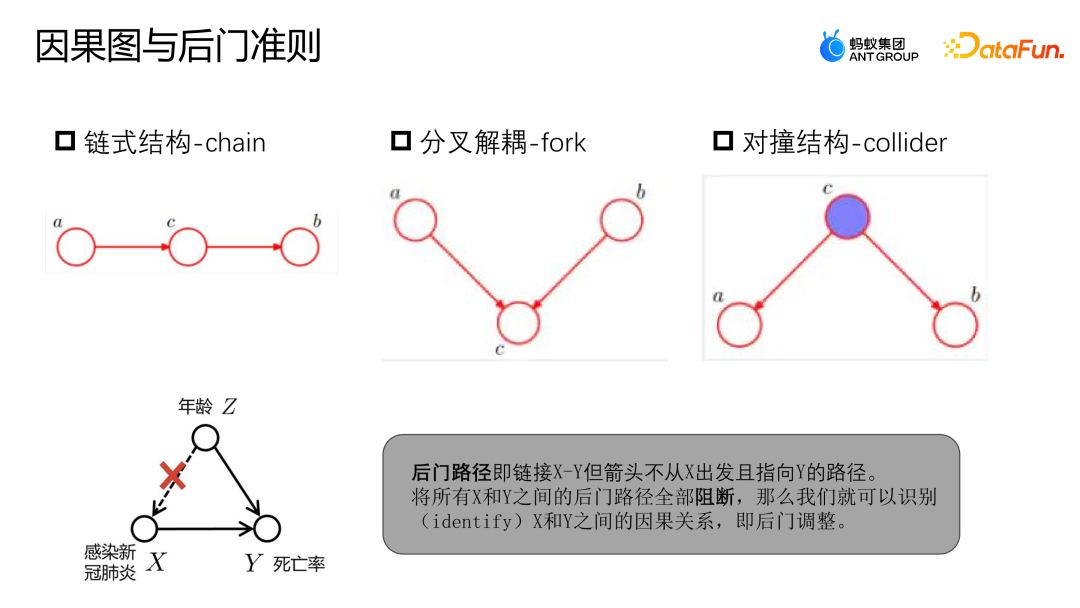
The cause-and-effect diagram is a directed and undirected diagram. Ring diagram is used to describe the causal relationship between nodes in the scene. It consists of chain structure, bifurcated structure and collision structure.
- Chain structure: Given C, A and B are independent.
- Forked structure: Given C, if A changes, B will not change accordingly.
- Collision structure: In the absence of C, it cannot be observed that A and B are independent; but after observing C, A and B are not independent.
You can refer to the example above to determine the backdoor path and backdoor criteria. The backdoor path refers to the path that links X to Y, but starts from Z and eventually points to Y. Similar to the previous example, the relationship between COVID-19 infection and mortality is not purely causal. Infection with COVID-19 is affected by age. Older people are more likely to be infected with COVID-19, and their mortality rate is also higher. However, if we have enough data to block all backdoor paths between X and Y, that is, given Z, then X and Y can be modeled as independent relationships, so that we can get the real Causal relationship.
##2. Correction based on data fusion
1. Introduction to data fusion correction model
The following introduces the work of the Ant team based on data fusion correction, which has been published on the Industry Track of SIGIR2023. The idea of the work is to use unbiased data to do data augmentation and guide the correction of the model.
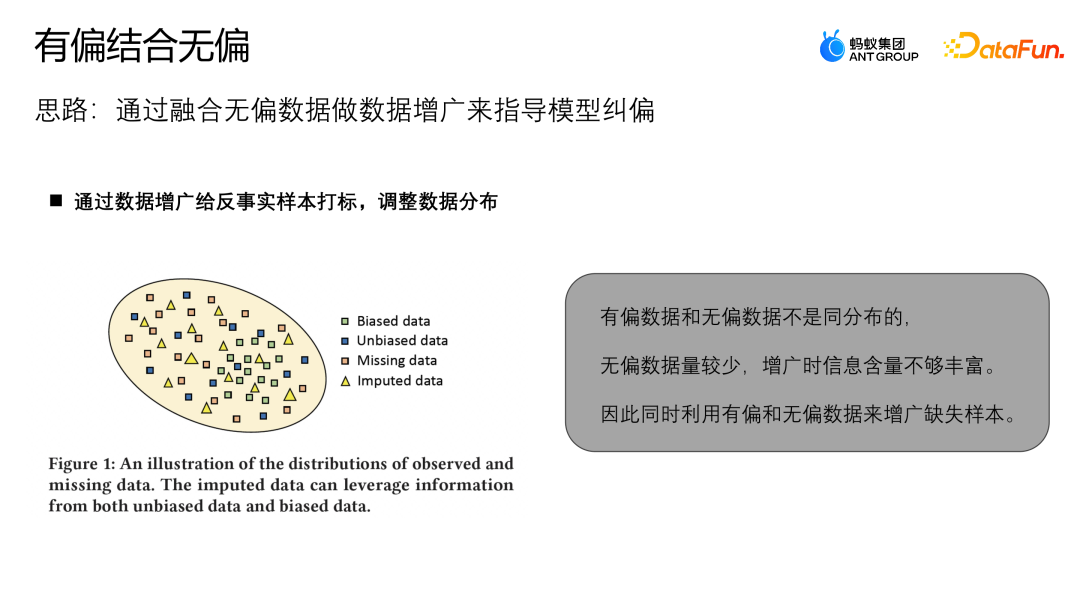
The overall distribution of unbiased data is different from that of biased data. Biased data will be concentrated in a certain part of the entire sample space, and the missing data The samples will be concentrated in some areas with relatively less biased data, so if the augmented samples are close to areas with more unbiased areas, the unbiased data will play a more important role; if the augmented samples are close to areas with biased data Region, then biased data will play more roles. For this purpose, this paper designs an MDI model that can better utilize unbiased and biased data for data augmentation.

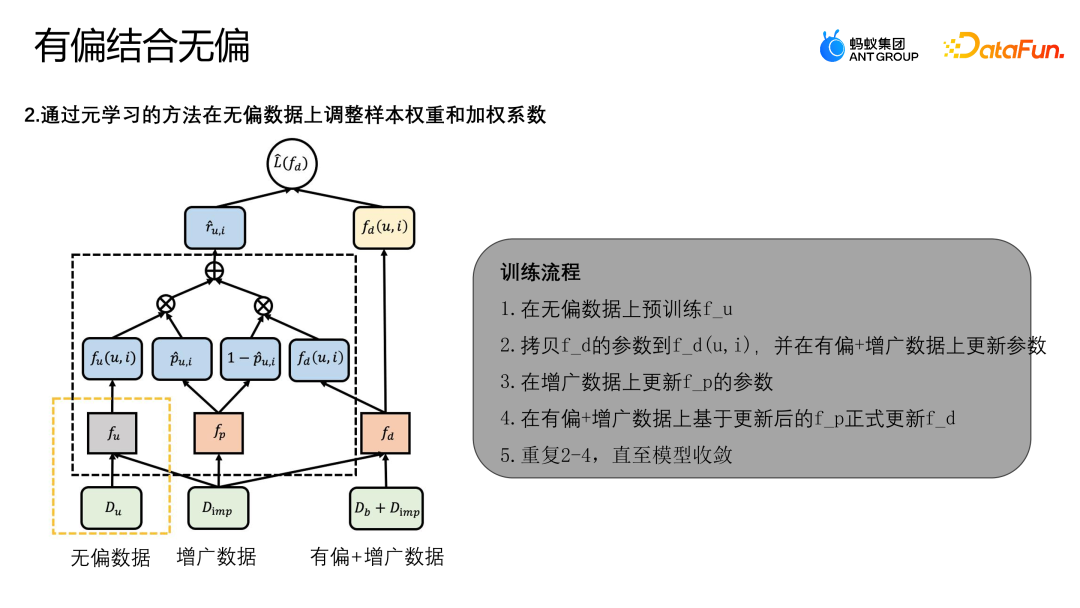
The above figure shows the framework diagram of the algorithm. The MDI model uses meta-learning to adjust the weight of samples on unbiased data and weighted coefficient. First of all, there are two stages in MDI model training:
- Phase 1: Use unbiased data to train an unbiased teacher model fu.
- Phase 2: Use the original learning method to update other structures in the schematic diagram.
Train the fusion debiasing model fd by optimizing the operating loss of L(fd). The final Loss loss mainly has two items, one is L-IPS and the other is L -IMP. L-IPS is an IPS module that we use for optimization using original samples; R-UI uses any model to derive the propensity score (determining the probability that a sample belongs to an unbiased sample or the probability that it belongs to a biased sample); the second item L-IMP is the weight of the preset augmentation module, R-UI is the tail index generated by the preset augmentation module; P-UI and 1-P-UI are the unbiased Teacher model and fusion model in the current sample. The propensity score of method to learn more complex pattern information, fp is solved through Meta learning.
The following is the complete training process of the algorithm:- Pre-train fu on unbiased data.
- Copy the parameters of fd to fd(u,i), and update the parameters on the biased augmented data.
- Update the parameters of fp on the augmented data.
- Officially update fd based on the updated fp based on the biased augmented data.
- Repeat 2-4 until the model converges.
2. Experiment on data fusion correction model
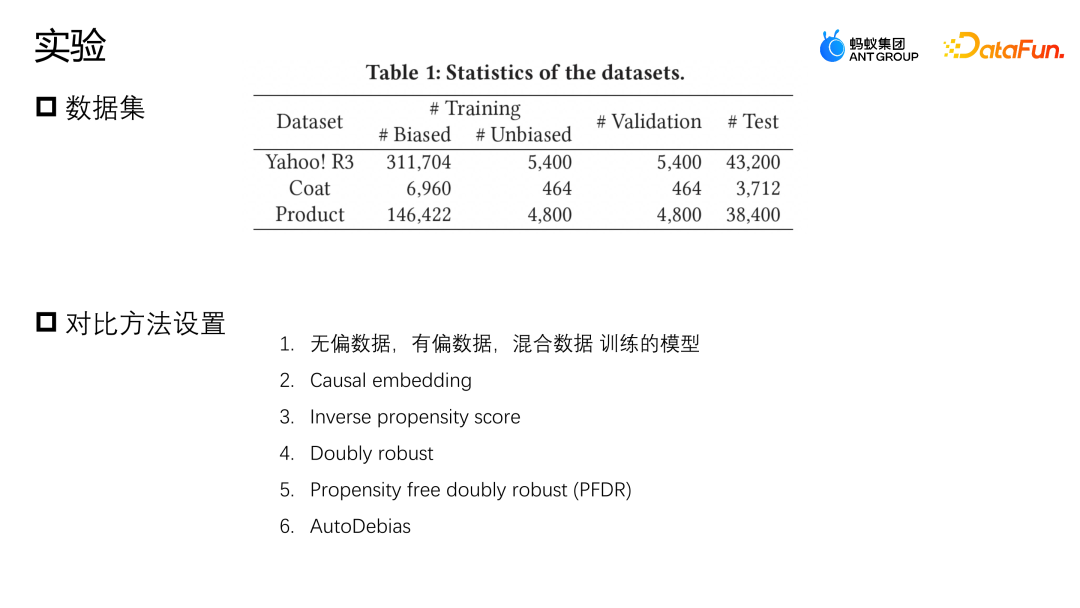
We conducted evaluations on two public datasets, Yahoo R3 and Coat. Yahoo R3 collected 15,000 users' ratings of 1,000 songs, and collected a total of 310,000 biased data and 5,400 pieces of unbiased data. The Coat data set collects 6900 pieces of biased data and 4600 pieces of unbiased data through 290 users' ratings of 300 pieces of clothing. The ratings of users in both data sets range from 1 to 5. The biased data comes from the data users of the platform, and the unbiased samples are collected by randomly assigning ratings to users.
In addition to two public data sets, Ant also used a data set from actual industry scenarios. In order to simulate the situation where there are very few unbiased data samples, we combined all biased data sets data and 10% of the unbiased data are used for training, 10% of the unbiased data is retained as validation, and the remaining 80% is used as the test set.The Baseline comparison methods we use are mainly as follows: the first method is to use models trained using unbiased data, single biased data and direct data fusion respectively; the second method The first method is to use a small amount of unbiased data to design a regular representation to constrain the biased data and the similarity represented by the unbiased data to perform correction operations; the third method is the inverse probability weight method, the propensity score An inverse probability. Double robust is also a common correction method; Propensity free double robust is a data augmentation method, which first uses unbiased samples to learn an augmented model, and then uses the augmented samples to help the entire model correct bias; Auto Debias will also use some unbiased data for augmentation to help correct model bias.
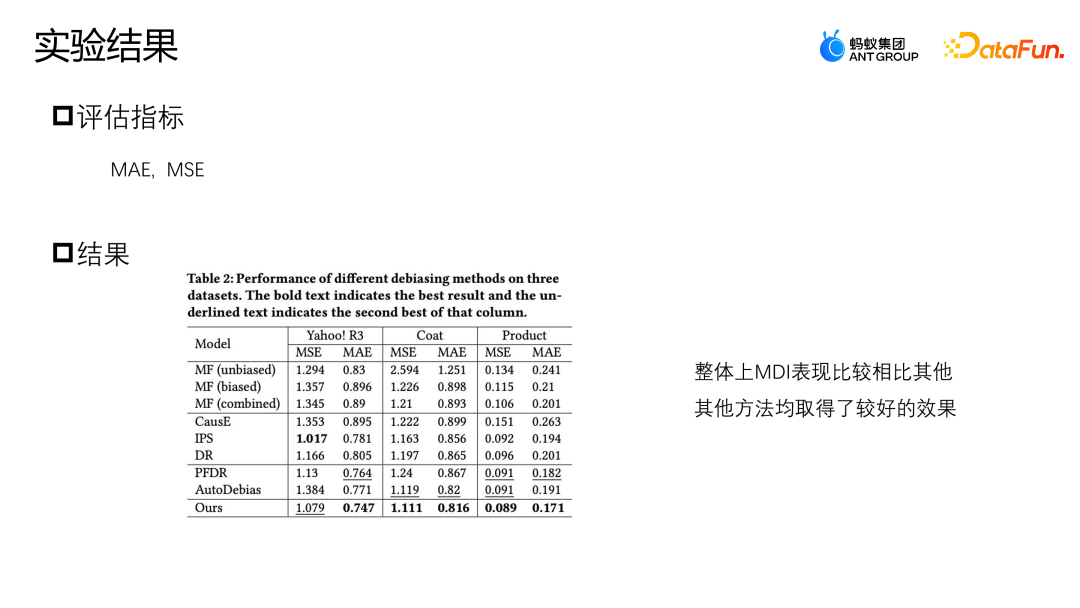
On the Yahoo R3 data set, the method we proposed has the best performance index on MAE, and the best performance on MSE except IPS. The three data augmentation methods, PFDR, Auto Debias and our proposed MDI, will perform better in most cases. However, since PFDR uses unbiased data to train the augmented model in advance, it will heavily rely on the unbiased data. Quality, so it only has 464 unbiased training data samples on the Coat model. When there are fewer unbiased samples, its augmentation module will be poor and the data performance will be relatively poor.
 AutoDebias performs exactly opposite to PFDR on different data. Since MDI has designed an augmentation method that utilizes both unbiased data and biased data, it has a stronger data augmentation module, so it can be obtained in both cases when there is less unbiased data or when there is sufficient unbiased data. Better results.
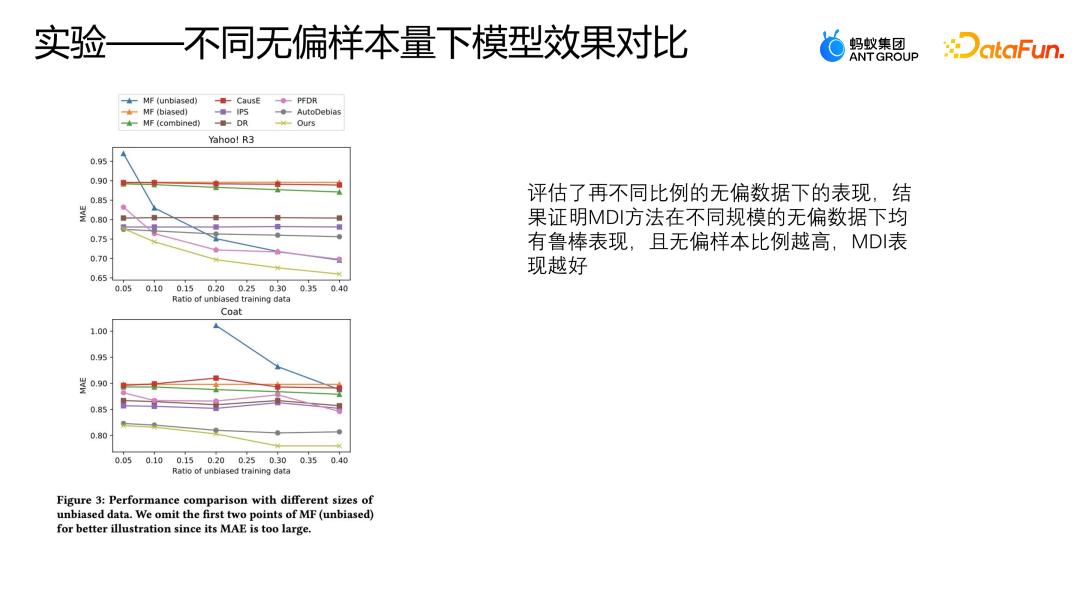
We also evaluated the performance of these models under different proportions of unbiased data on two public data sets, using 50% to 40% of unbiased data and all biased data respectively. For training, other logic is verified with the first 10% of the unbiased data, and the remaining data is used for testing. This setting is the same as the previous experiment.
The above figure shows the performance of MAE using different methods under different proportions of unbiased data. The abscissa represents the proportion of unbiased data, and the ordinate represents the effect of each method on unbiased data. You can see As the proportion of unbiased data increases, the MAE of AutoDebias, IPS and DoubleRubus has no obvious decline process. However, instead of following the Debias method, the method of directly using original data fusion to learn will have a relatively obvious decline. This is because the higher the sample proportion of unbiased data, the better our overall data quality is, so the model can learn Better performance.
When Yahoo R3 data uses more than 30% unbiased data for training,
This method even surpasses all other bias correction methods except MDI. However, the MDI method can achieve relatively better performance, which can also prove that the MDI method has relatively robust results under unbiased data of different sizes.
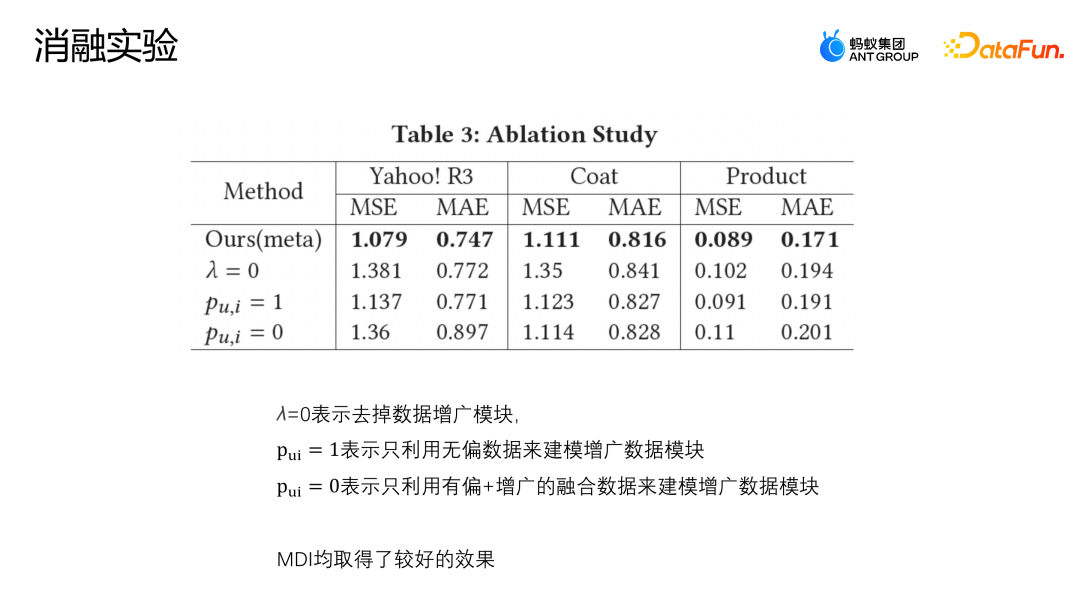
The setting of λ=0 means that the augmented module is directly removed; Pu,i = 1 means that only unbiased data is used to model the augmented data module; Pu,i = 0 means that only biased and augmented modules are used Fusion data modeling augmented data module. The above figure shows the results of the ablation experiment. It can be seen that the MDI method has achieved relatively good results on the three data sets, indicating that the augmentation module is necessary. Whether it is on a public data set or a data set in an actual business scenario, the augmentation method we proposed to fuse unbiased and biased data is better than the previous data. The fusion schemes all have better results, and the robustness of MDI is also verified through parameter sensitivity experiments and ablation experiments.
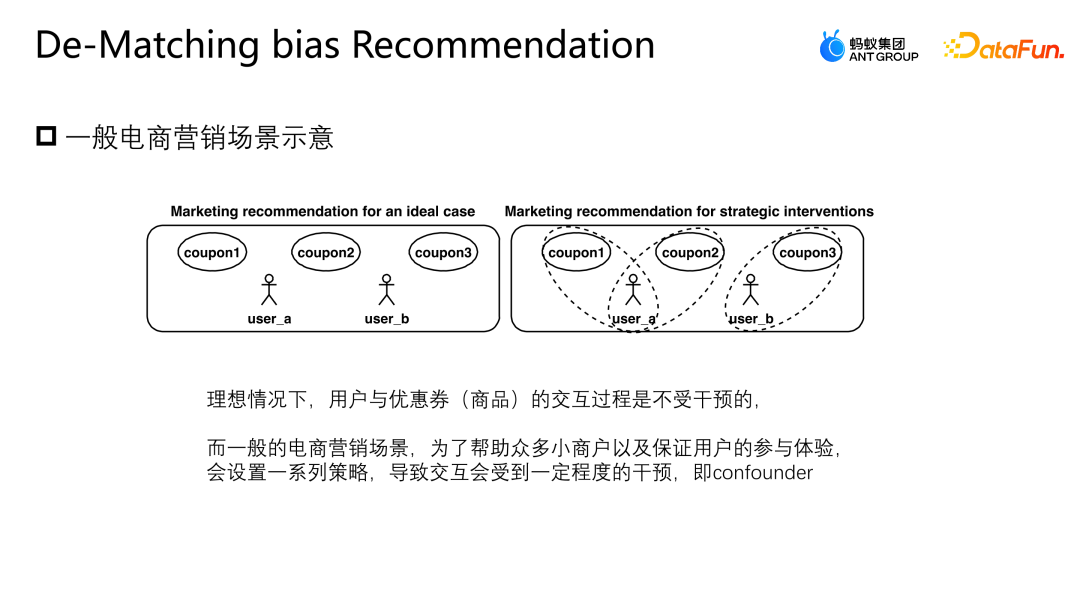
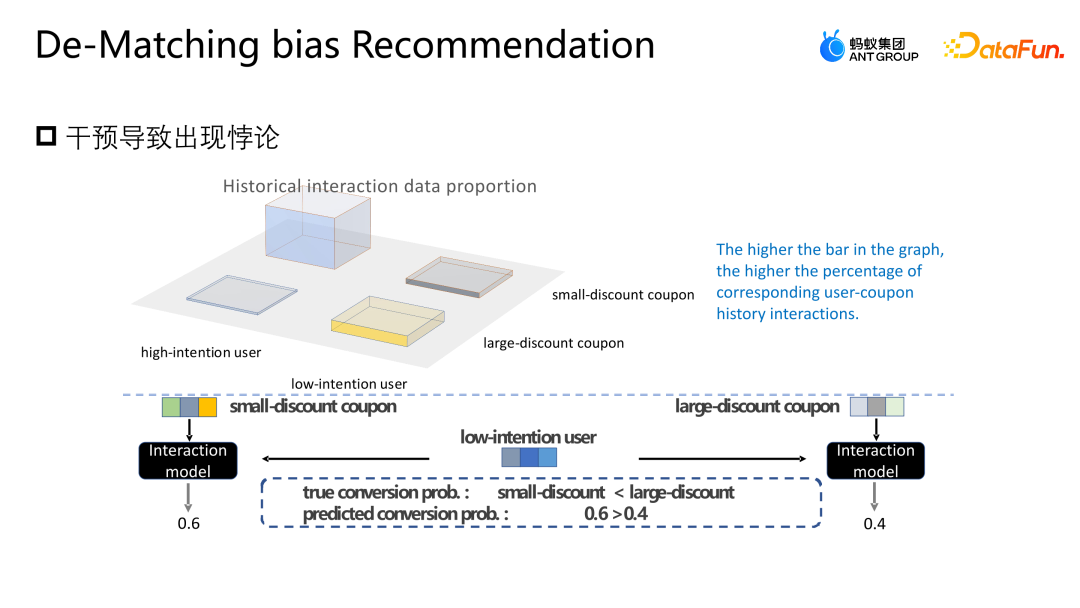
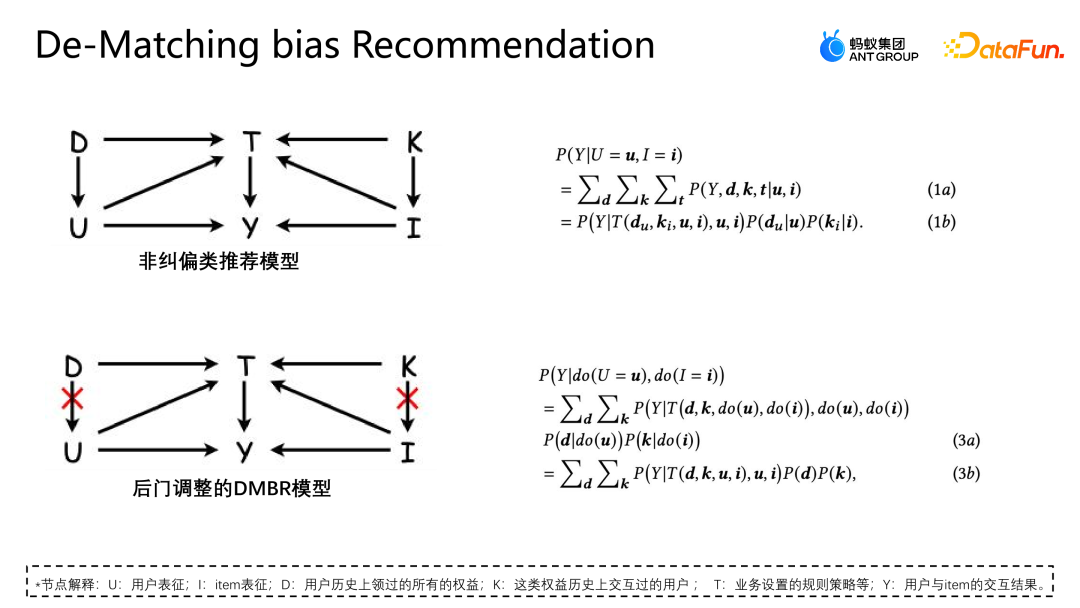
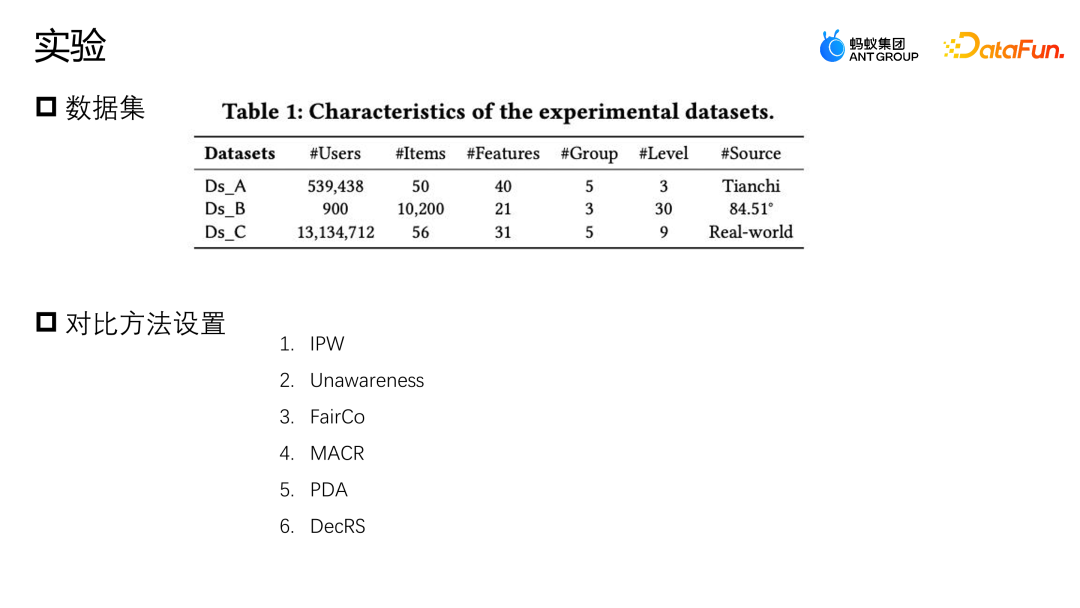
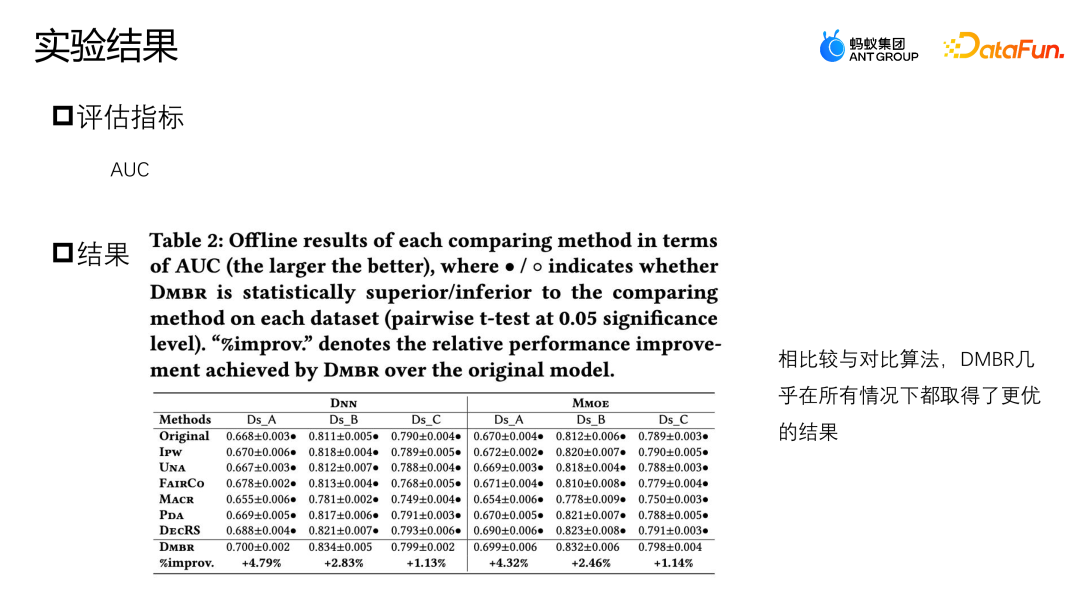
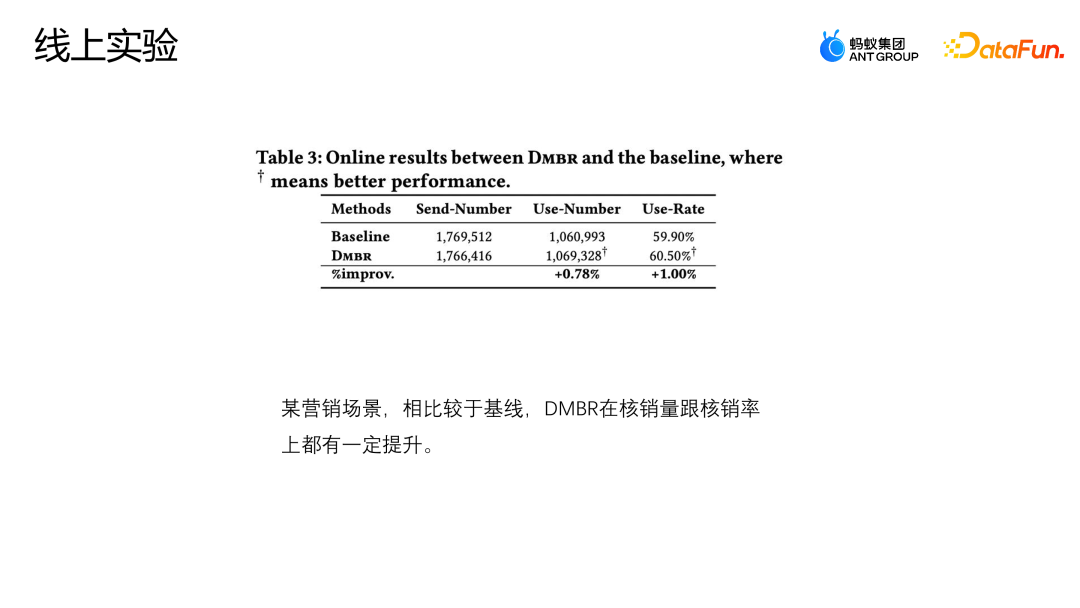
Let’s introduce another work of the team: adjustment and correction based on backdoor. This work has also been published on the Industry Track of SIGIR2023. The scenario of backdoor adjustment and correction application is the scenario of marketing recommendation. As shown in the figure below, the interaction between the user and the coupon or the user and any advertisement or item is not subject to any intervention. There is an equal possibility of any interaction, and each coupon also has an equal chance. may be exposed to any user. #But in actual business scenarios, in order to protect or help some small merchants to increase traffic and ensure the overall user participation experience, it is usually set A series of strategic constraints, this situation will cause some users to be more exposed to certain coupons, and other users to be more exposed to another coupon. This kind of intervention is the cofounder mentioned above. What problems will this kind of intervention cause in the e-commerce marketing scenario? As shown in the figure above, for simplicity, we simply divide users into two categories: high willingness to participate and low willingness to participate, and coupons into two categories: large discounts and small discounts. The height of the histogram in the figure represents the global proportion of the corresponding sample. The higher the histogram, the greater the proportion of the corresponding sample in the overall training data. The small discount coupons and high participation intention user samples shown in the figure account for the majority, which will cause the model to learn the distribution shown in the figure. The model will believe that high participation intention users prefer small discount coupons. But in fact, facing the same usage threshold, users will definitely prefer coupons with higher discounts, so that they can save more money. The model in the picture shows that the actual conversion probability of small discount coupons is lower than that of large discount coupons. However, the model's estimate for a certain sample will think that the write-off probability of small discount coupons is higher, so the model will also recommend this score. Corresponding coupons, this creates a paradox. Analyze the reasons for this paradox from the perspective of a cause-and-effect diagram, and apply a non-corrective recommendation model in the current scenario. Its cause-and-effect diagram structure As shown in the figure above, U represents the user's representation, and I represents the item's representation. D and K are the historical interactions between the user perspective and the equity perspective respectively. T represents some rule constraints set by the current business. T cannot be directly quantified, but we can indirectly see its impact on users and items through D and K. Impact. y represents the interaction between the user and the item, and the result is whether the item is clicked, written off, etc. The conditional probability formula represented by the causal diagram is shown in the upper right of the figure. The derivation of the formula follows the Bayesian probability formula. Under the given conditions of U and I, the final derivation of P|Y ui is not only related to U and I, because U will be affected by du, that is, when p is given u, the probability of p (du) also exists of. In the same way when I is given, I will also be affected by ki. The reason for this situation is that the existence of D and K leads to the existence of backdoor paths in the scene. That is, a backdoor path that does not start from U but eventually points to y (U-D-T-Y or I-K-T-Y path) will represent a false concept, that is, U can not only affect y through T, but also affect y through D. The adjustment method is to artificially cut off the path from D to U, so that U can only directly affect y through U-T-Y and U-Y. This method can remove false correlations , thereby modeling the true causal relationship. The backdoor adjustment is to do do-calculus on the observation data, and then use the do operator to aggregate the performance of all D and all K to prevent U and I from being affected by D and K. In this way a true cause and effect relationship is modeled. The derived approximate form of this formula is shown in the figure below. 4a is in the same form as the previous 3b, and 4b is an approximation of the sample space. Because theoretically the sample space of D and K is infinite, approximation can only be made through the collected data (D and K of the sample space take a size). 4c and 4d are both derivation of the desired approximation, in such a way that ultimately only one additional unbiased representation T needs to be modeled. T is an additional model of unbiased representation T by traversing the sum of the representation probability distributions of users and items in all situations to help the model obtain the final unbiased data estimate. The experiment uses two open source data sets, Tianchi and 84.51 (coupon) data sets. Simulate the impact of this rule strategy on the overall data through sampling. At the same time, data generated from a real e-commerce marketing activity scenario were used to jointly evaluate the quality of the algorithm. We compared some mainstream correction methods, such as IPW, which uses inverse probability weighting to correct bias; Unawareness alleviates the impact of bias by removing bias features; FairCo obtains relatively unbiased estimates by introducing error term constraint representations; MACR uses multiple The framework of the task estimates the consistency of the user and the popularity of the item respectively, and subtracts the consistency and popularity in the prediction stage to achieve unbiased estimation; PDA removes popularity by adjusting the loss item through causal intervention. The influence of bias; DecRS also uses backdoor adjustment to remove information bias, but it only corrects the bias of the user's perspective. The evaluation index of the experiment is AUC, because the marketing promotion scenario has only one recommended coupon or recommended candidate product, so it is essentially a two-category problem, so it is more appropriate to use AUC to evaluate. Comparing the performance of DNN and MMOE under different architectures, it can be seen that the DMBR model we proposed has better results than the original non-correction method and other correction methods. At the same time, Ds_A and Ds_B have achieved a higher improvement effect on the simulated data set than on the real business data set. This is because the data in the real business data set will be more complex and will not only be affected by rules and policies, but also may be affected by other factors. influence of factors. The current model has been launched in an e-commerce marketing event scenario. The above figure shows the online effect. Compared with the baseline model, the DMBR model has There has been a certain improvement in sales rate and verified sales volume.
The method of cause-and-effect correction is mainly used in ants in scenarios where there are rules or policy constraints. For example, in advertising scenarios, there may be restrictions on the people who can serve different ads. Some ads for pets will be more targeted at people with Pet users. In the e-commerce marketing scenario, some strategies will be set up to ensure the traffic of small merchants and avoid all traffic being consumed by large merchants. As well as ensuring the user experience of participating in activities, because the overall budget of the activity is limited, if some unscrupulous users repeatedly participate in the activity, a large amount of resources will be taken up, resulting in a poor activity participation experience for other users. In scenarios such as this, there are applications of cause and effect correction. ##3. Correction based on backdoor adjustment

##4. Application in Ant
The above is the detailed content of Application of cause-and-effect correction method in Ant Marketing recommendation scenario. For more information, please follow other related articles on the PHP Chinese website!

Hot AI Tools

Undresser.AI Undress
AI-powered app for creating realistic nude photos

AI Clothes Remover
Online AI tool for removing clothes from photos.

Undress AI Tool
Undress images for free

Clothoff.io
AI clothes remover

AI Hentai Generator
Generate AI Hentai for free.

Hot Article
Hot Tools

Notepad++7.3.1
Easy-to-use and free code editor

SublimeText3 Chinese version
Chinese version, very easy to use

Zend Studio 13.0.1
Powerful PHP integrated development environment

Dreamweaver CS6
Visual web development tools

SublimeText3 Mac version
God-level code editing software (SublimeText3)
Hot Topics
 1378
1378
 52
52

 How to implement a recommendation system using Go language and Redis
Oct 27, 2023 pm 12:54 PM
How to implement a recommendation system using Go language and Redis
Oct 27, 2023 pm 12:54 PM
How to use Go language and Redis to implement a recommendation system. The recommendation system is an important part of the modern Internet platform. It helps users discover and obtain information of interest. The Go language and Redis are two very popular tools that can play an important role in the process of implementing recommendation systems. This article will introduce how to use Go language and Redis to implement a simple recommendation system, and provide specific code examples. Redis is an open source in-memory database that provides a key-value pair storage interface and supports a variety of data
 Recommendation system algorithms and applications implemented in Java
Jun 19, 2023 am 09:06 AM
Recommendation system algorithms and applications implemented in Java
Jun 19, 2023 am 09:06 AM
With the continuous development and popularization of Internet technology, recommendation systems, as an important information filtering technology, are increasingly being widely used and paid attention to. In terms of implementing recommendation system algorithms, Java, as a fast and reliable programming language, has been widely used. This article will introduce the recommendation system algorithms and applications implemented in Java, and focus on three common recommendation system algorithms: user-based collaborative filtering algorithm, item-based collaborative filtering algorithm and content-based recommendation algorithm. User-based collaborative filtering algorithm is based on user-based collaborative filtering
 Application example: Use go-micro to build a microservice recommendation system
Jun 18, 2023 pm 12:43 PM
Application example: Use go-micro to build a microservice recommendation system
Jun 18, 2023 pm 12:43 PM
With the popularity of Internet applications, microservice architecture has become a popular architecture method. Among them, the key to the microservice architecture is to split the application into different services and communicate through RPC to achieve a loosely coupled service architecture. In this article, we will introduce how to use go-micro to build a microservice recommendation system based on actual cases. 1. What is a microservice recommendation system? A microservice recommendation system is a recommendation system based on microservice architecture. It integrates different modules in the recommendation system (such as feature engineering, classification
 The Secret of Accurate Recommendation: Detailed Explanation of Alibaba's Decoupled Domain Adaptation Unbiased Recall Model
Jun 05, 2023 am 08:55 AM
The Secret of Accurate Recommendation: Detailed Explanation of Alibaba's Decoupled Domain Adaptation Unbiased Recall Model
Jun 05, 2023 am 08:55 AM
1. Scenario introduction First, let’s introduce the scenario involved in this article—the “good goods are available” scenario. Its location is in the four-square grid on Taobao's homepage, which is divided into a one-hop selection page and a two-hop acceptance page. There are two main forms of acceptance pages, one is the image and text acceptance page, and the other is the short video acceptance page. The goal of this scenario is mainly to provide users with satisfactory goods and drive the growth of GMV, thereby further leveraging the supply of experts. 2. What is popularity bias, and why next we enter the focus of this article, popularity bias. What is popularity bias? Why does popularity bias occur? 1. What is popularity bias? Popularity bias has many aliases, such as Matthew effect and information cocoon room. Intuitively speaking, it is a carnival of high-explosive products. The more popular the product, the easier it is to be exposed. This will result in
 How does Go language implement cloud search and recommendation systems?
May 16, 2023 pm 11:21 PM
How does Go language implement cloud search and recommendation systems?
May 16, 2023 pm 11:21 PM
With the continuous development and popularization of cloud computing technology, cloud search and recommendation systems are becoming more and more popular. In response to this demand, the Go language also provides a good solution. In the Go language, we can use its high-speed concurrent processing capabilities and rich standard libraries to implement an efficient cloud search and recommendation system. The following will introduce how the Go language implements such a system. 1. Search on the cloud First, we need to understand the posture and principles of search. Search posture refers to the search engine matching pages based on the keywords entered by the user.
 Recommendation system for NetEase Cloud Music cold start technology
Nov 14, 2023 am 08:14 AM
Recommendation system for NetEase Cloud Music cold start technology
Nov 14, 2023 am 08:14 AM
1. Problem background: The necessity and importance of cold start modeling. As a content platform, Cloud Music has a large amount of new content online every day. Although the amount of new content on the cloud music platform is relatively small compared to other platforms such as short videos, the actual amount may far exceed everyone's imagination. At the same time, music content is significantly different from short videos, news, and product recommendations. The life cycle of music spans extremely long periods of time, often measured in years. Some songs may explode after being dormant for months or years, and classic songs may still have strong vitality even after more than ten years. Therefore, for the recommendation system of music platforms, it is more important to discover unpopular and long-tail high-quality content and recommend them to the right users than to recommend other categories.
 Application of cause-and-effect correction method in Ant Marketing recommendation scenario
Jan 13, 2024 pm 12:15 PM
Application of cause-and-effect correction method in Ant Marketing recommendation scenario
Jan 13, 2024 pm 12:15 PM
1. Background of cause-and-effect correction 1. Deviation occurs in the recommendation system. The recommendation model is trained by collecting data to recommend appropriate items to users. When users interact with recommended items, the data collected is used to further train the model, forming a closed loop. However, there may be various influencing factors in this closed loop, resulting in errors. The main reason for the error is that most of the data used to train the model is observation data rather than ideal training data, which is affected by factors such as exposure strategy and user selection. The essence of this bias lies in the difference between the expectations of empirical risk estimates and the expectations of true ideal risk estimates. 2. Common biases There are three main types of common biases in recommendation marketing systems: Selective bias: It is due to the user’s root
 Recommendation system and collaborative filtering technology in PHP
May 11, 2023 pm 12:21 PM
Recommendation system and collaborative filtering technology in PHP
May 11, 2023 pm 12:21 PM
With the rapid development of the Internet, recommendation systems have become more and more important. A recommendation system is an algorithm used to predict items of interest to a user. In Internet applications, recommendation systems can provide personalized suggestions and recommendations, thereby improving user satisfaction and conversion rates. PHP is a programming language widely used in web development. This article will explore recommendation systems and collaborative filtering technology in PHP. Principles of recommendation systems Recommendation systems rely on machine learning algorithms and data analysis. It analyzes and predicts user historical behavior.
