

Detailed explanation of how to save Matplotlib images


Detailed explanation of Matplotlib image saving method
Matplotlib is a Python drawing library that is widely used in data visualization and scientific computing. After drawing an image, we often need to save the image for subsequent use or share it with others. This article will introduce several common methods of saving Matplotlib images and provide specific code examples.
1. Save as a picture file
Matplotlib provides the savefig() function to save the current image as a picture file. The basic usage of this function is as follows:
import matplotlib.pyplot as plt

# 绘制图像代码

plt.savefig('image.png') # 保存图像为PNG格式savefig() function supports saving common image formats, such as PNG, JPEG, BMP, etc. By specifying the suffix of the file name, you can save it as an image file in the corresponding format.
Sample code:
import numpy as np
import matplotlib.pyplot as plt

# 生成数据
x = np.linspace(0, 2*np.pi, 100)
y = np.sin(x)

# 绘制图像
plt.plot(x, y)

# 保存图像为PNG格式
plt.savefig('sin_wave.png')2. Adjust the resolution and size of the saved image
When saving the image, we can adjust the resolution and size to meet specific needs. Matplotlib provides some parameters for controlling the resolution and size of saved images.
- dpi parameter
dpi (dots per inch) represents the number of pixels per inch. The resolution of the saved image can be adjusted through the dpi parameter. By default, the dpi parameter is the dpi value of the figure. The sample code is as follows:
plt.savefig('image.png', dpi=300) # 设置分辨率为300dpi- figsize parameter
The figsize parameter is used to set the size of the image. The value of this parameter is a tuple, indicating the width and height of the image ( Units are inches). The sample code is as follows:
plt.figure(figsize=(6, 4))  # 设置图片大小为6x4英寸
plt.plot(x, y)
plt.savefig('image.png')3. Save as vector image
Vector image is a file format that uses geometric figures to describe images. Unlike bitmaps, vector images can be enlarged and reduced without loss. No distortion. In scientific research and publishing, vector graphics are often used to store and display graphic data.
Matplotlib supports saving images in vector formats, such as PDF, SVG, EPS, etc. The sample code is as follows:
plt.savefig('image.pdf')  # 保存为PDF格式
plt.savefig('image.svg')  # 保存为SVG格式
plt.savefig('image.eps') # 保存为EPS格式4. Save in other formats
In addition to common picture formats and vector formats, Matplotlib also supports saving images in other formats, such as LaTeX, PGF, etc. If you want to save to these formats, you need to install the corresponding expansion pack and save according to the corresponding method.
To sum up, this article introduces several common methods of saving Matplotlib images and provides specific code examples. By choosing the appropriate saving method and adjusting parameters, the needs in different scenarios can be met. I hope this article can help readers better save and share images drawn by Matplotlib.
The above is the detailed content of Detailed explanation of how to save Matplotlib images. For more information, please follow other related articles on the PHP Chinese website!

Hot AI Tools

Undresser.AI Undress
AI-powered app for creating realistic nude photos

AI Clothes Remover
Online AI tool for removing clothes from photos.

Undress AI Tool
Undress images for free

Clothoff.io
AI clothes remover

Video Face Swap
Swap faces in any video effortlessly with our completely free AI face swap tool!

Hot Article
Hot Tools

Notepad++7.3.1
Easy-to-use and free code editor

SublimeText3 Chinese version
Chinese version, very easy to use

Zend Studio 13.0.1
Powerful PHP integrated development environment

Dreamweaver CS6
Visual web development tools

SublimeText3 Mac version
God-level code editing software (SublimeText3)
Hot Topics
 1387
1387
 52
52

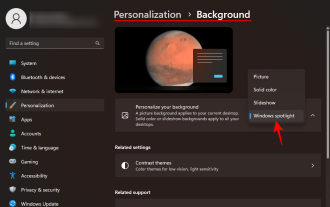 How to Download Windows Spotlight Wallpaper Image on PC
Aug 23, 2023 pm 02:06 PM
How to Download Windows Spotlight Wallpaper Image on PC
Aug 23, 2023 pm 02:06 PM
Windows are never one to neglect aesthetics. From the bucolic green fields of XP to the blue swirling design of Windows 11, default desktop wallpapers have been a source of user delight for years. With Windows Spotlight, you now have direct access to beautiful, awe-inspiring images for your lock screen and desktop wallpaper every day. Unfortunately, these images don't hang out. If you have fallen in love with one of the Windows spotlight images, then you will want to know how to download them so that you can keep them as your background for a while. Here's everything you need to know. What is WindowsSpotlight? Window Spotlight is an automatic wallpaper updater available from Personalization > in the Settings app
 How to save pictures without watermark in Xiaohongshu How to save pictures without watermark in Xiaohongshu
Mar 22, 2024 pm 03:40 PM
How to save pictures without watermark in Xiaohongshu How to save pictures without watermark in Xiaohongshu
Mar 22, 2024 pm 03:40 PM
Xiaohongshu has rich content that everyone can view freely here, so that you can use this software to relieve boredom every day and help yourself. In the process of using this software, you will sometimes see various beautiful things. Many people want to save pictures, but the saved pictures have watermarks, which is very influential. Everyone wants to know how to save pictures without watermarks here. The editor provides you with a method for those in need. Everyone can understand and use it immediately! 1. Click the "..." in the upper right corner of the picture to copy the link 2. Open the WeChat applet 3. Search the sweet potato library in the WeChat applet 4. Enter the sweet potato library and confirm to get the link 5. Get the picture and save it to the mobile phone album
 How to handle image compression when saving remote images using PHP?
Jul 15, 2023 pm 03:57 PM
How to handle image compression when saving remote images using PHP?
Jul 15, 2023 pm 03:57 PM
How to handle image compression when saving remote images using PHP? In actual development, we often need to obtain images from the network and save them to the local server. However, some remote images may be too large, which requires us to compress them to reduce storage space and increase loading speed. PHP provides some powerful extensions to handle image compression, the most commonly used of which are the GD library and the Imagick library. The GD library is a popular image processing library that provides many functions for creating, editing and saving images. Here is a use
 How to download and save Douyin videos
Mar 29, 2024 pm 02:16 PM
How to download and save Douyin videos
Mar 29, 2024 pm 02:16 PM
1. Open the Douyin app, find the video you want to download and save, and click the [Share] button in the lower right corner. 2. In the pop-up window that appears, slide the function buttons in the second row to the right, find and click [Save Local]. 3. A new pop-up window will appear at this time, and the user can see the download progress of the video and wait for the download to complete. 4. After the download is completed, there will be a prompt of [Saved, please go to the album to view], so that the video just downloaded will be successfully saved to the user's mobile phone album.
 iOS 17: How to use one-click cropping in photos
Sep 20, 2023 pm 08:45 PM
iOS 17: How to use one-click cropping in photos
Sep 20, 2023 pm 08:45 PM
With the iOS 17 Photos app, Apple makes it easier to crop photos to your specifications. Read on to learn how. Previously in iOS 16, cropping an image in the Photos app involved several steps: Tap the editing interface, select the crop tool, and then adjust the crop using a pinch-to-zoom gesture or dragging the corners of the crop tool. In iOS 17, Apple has thankfully simplified this process so that when you zoom in on any selected photo in your Photos library, a new Crop button automatically appears in the upper right corner of the screen. Clicking on it will bring up the full cropping interface with the zoom level of your choice, so you can crop to the part of the image you like, rotate the image, invert the image, or apply screen ratio, or use markers
 How to save the videos of the video account to the photo album? Method sharing
Mar 26, 2024 am 11:21 AM
How to save the videos of the video account to the photo album? Method sharing
Mar 26, 2024 am 11:21 AM
Video account is a popular short video application that allows users to shoot, edit and share their own videos. However, sometimes we may want to save these amazing videos to our photo album so that we can always look back at them when needed. So, next I will share some methods to teach you how to save the video of the video account to the album. Videos can be saved through the built-in function of the Video Number application. Open the app and find the video you want to save. Click the options icon in the lower right corner of the video, a menu will pop up, select "Save to Album". This will save the video to your phone's photo album. Method two is to save the video by taking a screenshot. This method is relatively straightforward, but the saved image will contain elements such as video control bars, which is not pure enough. you
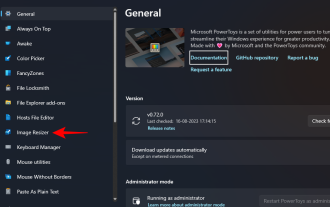 How to batch resize images using PowerToys on Windows
Aug 23, 2023 pm 07:49 PM
How to batch resize images using PowerToys on Windows
Aug 23, 2023 pm 07:49 PM
Those who have to work with image files on a daily basis often have to resize them to fit the needs of their projects and jobs. However, if you have too many images to process, resizing them individually can consume a lot of time and effort. In this case, a tool like PowerToys can come in handy to, among other things, batch resize image files using its image resizer utility. Here's how to set up your Image Resizer settings and start batch resizing images with PowerToys. How to Batch Resize Images with PowerToys PowerToys is an all-in-one program with a variety of utilities and features to help you speed up your daily tasks. One of its utilities is images
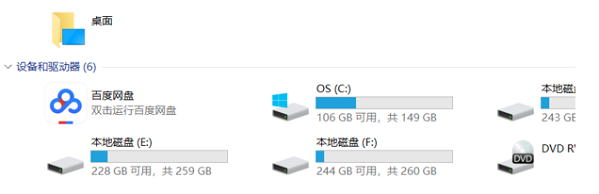 Where are the files scanned by HP printer stored?
Feb 19, 2024 am 09:18 AM
Where are the files scanned by HP printer stored?
Feb 19, 2024 am 09:18 AM
After using HP printers to scan files, many users don't know where the scanned files are saved. If they want to find out where they are, they can search as scheduled in My Computer. Where are the files scanned by HP printers saved: 1. First open My Computer. 2. Then enter the date to search. 3. Then you can find the scanned files. 4. After the printer driver is installed, there will be a printer multifunction machine auxiliary software, open it. 5. Finally, click the scan folder icon to find the file.
