From zero to full visibility of MySQL in 3 minutes with Perc_MySQL
First, I would like to invite you to my webinar, “Monitoring All (Yes, All!) MySQL Metrics with Percona Cloud Tools,” on Wednesday, June 25 at 10 a.m. Pacific Daylight Time, where I will talk on the
new features inPercona Cloud Tools, including monitoring capabilities.
In this post I’d like to show the cool and interesting things we’ve implemented in Percona Cloud Tools, including the recently releasedagentthat Daniel also talks about here inthis post.
Basically our agent allows users to collectALL MySQL metricsplus important environment’s metrics, like CPU, memory, IO stats.
And when I talk all MySQL it is:
- Metrics fromSHOW GLOBAL STATUS(I counted 571 entries on my Percona Server 5.6 with TokuDB)
- Metrics fromINFORMATION_SCHEMA.INNODB_METRICS( 214 entries)
- Data fromSHOW GLOBAL VARIABLES( 522 entries).
So you see we collect more than 1000 points. We collect dataevery second, aggregate per minute and it becomes available with a 1-minute resolution, but with descriptive stats likemin, max, avg, median, 5%-percentile, 95%-percentileof collected data. We found this represents data better than 1-sec points, which can be a quite noisy.
So for example this is how a chart with MySQL command counters looks like:
If you do not have MySQL, in fact, you can just monitor your OS without MySQL if you need to.
For example CPU stats
Please note you can see a value at any point in the past. We even can go to week range and see values several days ago
You can choose a custom timerange back to hours, days, weeks, etc with zoom-in capabilities.
Why do we need avg, min, max stats? Let see Peter’s graph from a server with periodical stalls.
Averaging metric smooths the line, and really hides the problem, while withminwe are able to see that throughput drops to zero, that means that during some seconds the server did not execute any queries (which is essentially stalls)
More about the agent.
Our percona-agent is open source. This is our way of sharing our Go knowledge, and also you can check that we do not do anything insane on your server (like bitcoin mining or black magic regression modeling math).
You can see source code herehttps://github.com/percona/percona-agent:
and pre-compiled binaries are available fromour website:
What is also interesting about our technology is that we use a permanent connection (based on WebSockets technology, so it looks like a connection to web browser) between an agent and our servers. This way
we support a bi-directional real-time communication betweenhttps://cloud.percona.com/and an agent.
That means you can manage an agent and receive data updates at the same time. Pretty cool, yeah?
Our agent comes with “minimal efforts” in mind.
- 1. There is minimal efforts to install agent. Basically it takes 3-minutes
to download binaries, install them, and start seeing real-time updates of charts with MySQL metrics. - 2. Agent comes with self-update capabilities (not activated at this moment). Later you will need
to worry if there is new version of agent is available, it will updated itself. We thought if Android Apps can do that, why can’t we? - 3. Minimal efforts for a maintenance: you do not need to install a dedicated server, configure and maintain database, care about its backups and availability. Basically no more hassle with Cacti configuration and managing a storage for it.
The goal ofPercona Cloud Toolsis to provide you with FULL visibility on what’s going on inside your system right now or at some point in the past, and to gain additional insights on your database server.
Our tools are useful not only if you have hundreds of database servers to manage, but pretty much for single installations, too. Well, of course, we always can runmysql -e "SHOW GLOBAL STATUS" , vmstat 10 ; iostat -dxm 10manually when we need to troubleshoot something, but is it not useful to collect all this data automatically and be able to go to any point in the past?
You canregister for the Betaright now. No invitation is needed, but it may take sometime for us to activate your account, we see a quite a demand right now and we need to prime our servers.
And what’s important, eventually our tools will require a payment, but we will always provide a free level, which will be useful enough for small accounts (this is not a bait-and-switch 30-days trial approach).

Hot AI Tools

Undresser.AI Undress
AI-powered app for creating realistic nude photos

AI Clothes Remover
Online AI tool for removing clothes from photos.

Undress AI Tool
Undress images for free

Clothoff.io
AI clothes remover

Video Face Swap
Swap faces in any video effortlessly with our completely free AI face swap tool!

Hot Article

Hot Tools

Notepad++7.3.1
Easy-to-use and free code editor

SublimeText3 Chinese version
Chinese version, very easy to use

Zend Studio 13.0.1
Powerful PHP integrated development environment

Dreamweaver CS6
Visual web development tools

SublimeText3 Mac version
God-level code editing software (SublimeText3)

Hot Topics
 1389
1389
 52
52
 When might a full table scan be faster than using an index in MySQL?
Apr 09, 2025 am 12:05 AM
Full table scanning may be faster in MySQL than using indexes. Specific cases include: 1) the data volume is small; 2) when the query returns a large amount of data; 3) when the index column is not highly selective; 4) when the complex query. By analyzing query plans, optimizing indexes, avoiding over-index and regularly maintaining tables, you can make the best choices in practical applications.
 Can I install mysql on Windows 7
Apr 08, 2025 pm 03:21 PM
Yes, MySQL can be installed on Windows 7, and although Microsoft has stopped supporting Windows 7, MySQL is still compatible with it. However, the following points should be noted during the installation process: Download the MySQL installer for Windows. Select the appropriate version of MySQL (community or enterprise). Select the appropriate installation directory and character set during the installation process. Set the root user password and keep it properly. Connect to the database for testing. Note the compatibility and security issues on Windows 7, and it is recommended to upgrade to a supported operating system.
 Explain InnoDB Full-Text Search capabilities.
Apr 02, 2025 pm 06:09 PM
InnoDB's full-text search capabilities are very powerful, which can significantly improve database query efficiency and ability to process large amounts of text data. 1) InnoDB implements full-text search through inverted indexing, supporting basic and advanced search queries. 2) Use MATCH and AGAINST keywords to search, support Boolean mode and phrase search. 3) Optimization methods include using word segmentation technology, periodic rebuilding of indexes and adjusting cache size to improve performance and accuracy.
 Difference between clustered index and non-clustered index (secondary index) in InnoDB.
Apr 02, 2025 pm 06:25 PM
The difference between clustered index and non-clustered index is: 1. Clustered index stores data rows in the index structure, which is suitable for querying by primary key and range. 2. The non-clustered index stores index key values and pointers to data rows, and is suitable for non-primary key column queries.
 MySQL: Simple Concepts for Easy Learning
Apr 10, 2025 am 09:29 AM
MySQL is an open source relational database management system. 1) Create database and tables: Use the CREATEDATABASE and CREATETABLE commands. 2) Basic operations: INSERT, UPDATE, DELETE and SELECT. 3) Advanced operations: JOIN, subquery and transaction processing. 4) Debugging skills: Check syntax, data type and permissions. 5) Optimization suggestions: Use indexes, avoid SELECT* and use transactions.
 The relationship between mysql user and database
Apr 08, 2025 pm 07:15 PM
In MySQL database, the relationship between the user and the database is defined by permissions and tables. The user has a username and password to access the database. Permissions are granted through the GRANT command, while the table is created by the CREATE TABLE command. To establish a relationship between a user and a database, you need to create a database, create a user, and then grant permissions.
 Explain different types of MySQL indexes (B-Tree, Hash, Full-text, Spatial).
Apr 02, 2025 pm 07:05 PM
MySQL supports four index types: B-Tree, Hash, Full-text, and Spatial. 1.B-Tree index is suitable for equal value search, range query and sorting. 2. Hash index is suitable for equal value searches, but does not support range query and sorting. 3. Full-text index is used for full-text search and is suitable for processing large amounts of text data. 4. Spatial index is used for geospatial data query and is suitable for GIS applications.
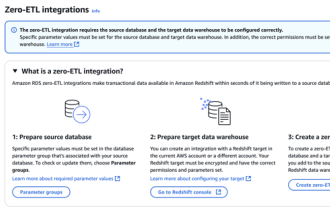 RDS MySQL integration with Redshift zero ETL
Apr 08, 2025 pm 07:06 PM
Data Integration Simplification: AmazonRDSMySQL and Redshift's zero ETL integration Efficient data integration is at the heart of a data-driven organization. Traditional ETL (extract, convert, load) processes are complex and time-consuming, especially when integrating databases (such as AmazonRDSMySQL) with data warehouses (such as Redshift). However, AWS provides zero ETL integration solutions that have completely changed this situation, providing a simplified, near-real-time solution for data migration from RDSMySQL to Redshift. This article will dive into RDSMySQL zero ETL integration with Redshift, explaining how it works and the advantages it brings to data engineers and developers.


