Steps to draw a mind map using Visio
How to draw a mind map using visio
The specific steps for drawing a mind map in Visio are as follows:
1. Open visio; select "File"-"New"-"Business"-"Brain Trigger Map";
Drag the "Inspiration Shape" in the "Shapes" window on the left to the drawing area. Double-click the topic text and rewrite it as "Mind Map." Right-click on the main title and select "Change Title Shape" to change it to a rectangle.
3. Right-click the main title and select "Add multiple subtitles..."; and add three subtitles in sequence: "What is?" "What is it used for?" and "How to use it?";
4. Right-click one of the subtitles and select "Change Title Shape..."; change the title shape in turn;
5. Add each subtitle to the "What is?" subtitle in sequence; the specific titles are as follows:
Classification, systematization, visualization, radial, heart blood vessels, brain branches;
6. Select "View" - "Toolbar"; you can bring up the required toolbars in turn; for example, bring up the ink toolbar;
7. The tools called up are personalized and customized for each branch title of "What is?" to facilitate understanding and memory; the toolbars involved include "Picture", "Ink", "Format Text" Format shapes, etc.";
8. Follow the previous step and add detailed branch titles for "What is it used for?" and "How to use it?"; the specific titles are as follows:
What’s the use? : Discussing questions, making plans, reading notes, making presentations;
how to use? : Keywords, levels, hand-drawing, tools (VISIO, XMind, MindManager);
9. You can follow the above process and draw the mind map you need;
How to draw a visio flow chart
Visio skills summary:
1. When drawing in Visio, when two straight lines intersect, a cross-line sign will always appear by default. It is very unpleasant. How to remove it: select the line, then menu Format->Behavior->Connecting Line->Span Line->Add->Never, that's it.
2. Add connection points. There is a drop-down button next to the button of the connection line. Select the cross symbol, which is the connection point command. Select the block diagram that needs to be added, and hold down the ctrl left button to add connection points.
3. Adsorption of connecting lines and objects. In order to facilitate later modification and adjustment, the connecting line must be adsorbed to the object it is connected to, otherwise you will cry when making later adjustments! The adsorption operation is very simple. You only need to drag the connection line to the object to be adsorbed with the left button of the mouse. When you see a radiating red dot flashing slightly, it means that the connection line and the object are successfully adsorbed together. Drag again. Try moving the object. Does the connecting line move with the object?
4. Add text on the connection line. Very simple! Just click the left mouse button on the line to add text!
5. Adjust the canvas size. Hold down Ctrl, then place the mouse on the edge of the canvas and drag.
6. How to make your drawing more professional with Visio
Questions and Answers:
(1) How to solve the problem of dotted lines turning into solid lines when pasting Visio graphics into word
Symptoms: Copy graphics in Visio and paste them into Microsoft Office documents (such as doc, ppt), and the dotted lines in the graphics appear as solid lines.
Cause: Visio renders extremely long lines and very thin lines as solid lines to reduce the size of Enhanced Metafile (EMF) embedded objects. By doing this, Visio avoids file size increases when objects are embedded in other program documents, and also helps avoid printer buffer overflows.
Solution: Click the graphic to enter the editing state, select the dotted line that needs to be modified, click the right-click shortcut menu "Format-Line", make the thickness appropriately bold, and confirm to save. If the above symptoms still occur, it means that the line is not thick enough and needs to be thickened appropriately.
(2) How to fill color in hand-drawn graphics in Visio
Symptom: After drawing the desired shape in Visio, it turns out that the specified color cannot be filled.
Reason: The drawn figure is a non-closed overall figure. By default in Visio, only closed overall figures can be filled with color.
Solution: Ensure that the drawn graphics are closed overall graphics. You can verify this by clicking on each element in the graphic (such as sides, corners). If the entire graphic enters the editing state after clicking, it means it is whole. Then zoom in and visually check whether it is closed. In fact, this check is only needed when it cannot be filled. of. How to ensure that the drawn figure is a closed overall figure? You can select a straight line in the drawing and draw the desired figure with one stroke. One stroke means that after drawing an edge, click the left button of the mouse and continue drawing without leaving the turning point. Next edge until it coincides with the starting point.
(3) How to rotate the graphics in the Visio template to the required angle
Symptoms: When the basic graphic elements given in the template are combined into the required graphics, they cannot be combined according to the required angle
Reason: The default rotation angle of basic graphics in Viso is 90 degrees clockwise (or counterclockwise).
Solution: Select the basic graphic you want to rotate, right-click and select View->Size and Position window, and then adjust the angle in this window. The angle direction is positive counterclockwise. In addition, graphics can be combined or copied through mirror symmetry and folding.
1. Select the object, hold down the ctrl key, and scroll the wheel to zoom in and out the image display ratio
2. Select the block diagram template. Under the "Block" block, there is an open one-dimensional one-way arrow. You can draw a graphic with a rectangle and an arrow combined, or you can modify the "one-dimensional one-way arrow" to be open. The method is to right-click the "one-dimensional one-way arrow" and select the corresponding menu command;
3. The shape format can be modified in the toolbar without right-clicking and selecting as before;
4. Edit visio in world. After editing, click once in the blank space to exit visio and return to world;
5. Self-made mold method: 1) Use visio to create graphics, 2) Open "File" -> "Shape" -> "New Mold", 3) Drag in the self-drawn shape in the newly added left column mold , 4) Change the block name and graphic name to your own name, 5) Save
6. Regarding the problem of large redundant blank spaces when copying visio pictures to word. The solution is to right-click the picture in Word and select "Show 'Picture' Toolbar", select Crop, subtract the excess white space, and then drag the Visio picture to the appropriate size
How to draw a flow chart How to use visio to draw a flow chart
How to draw a flow chart using visio:
Tools: Microsoft Office Visio
Steps to draw a flow chart using visio:
(1) Search for Microsoft Office Visio green software in the search engine;
(2) Download to your computer and install Microsoft Office Visio software, just follow the next step;
(3)The Microsoft Office Visio 2003 version is installed here. After the installation is completed, open the software.
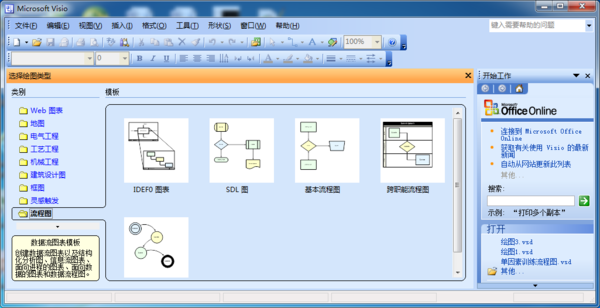
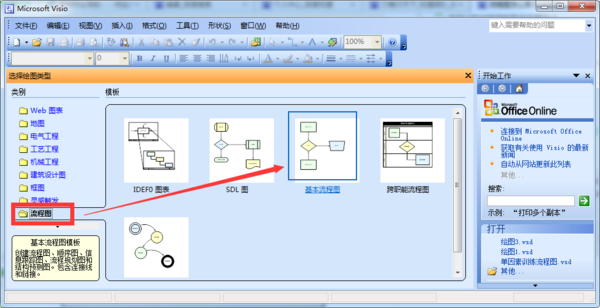
(4) Select [Flowchart] - [Basic Flowchart] on the left to open.
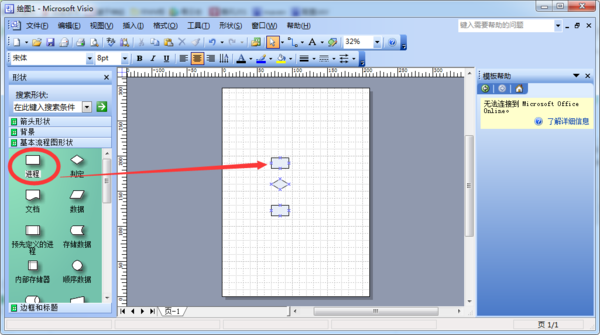
(5) Drag the required flow chart shape on the left into the drawing panel, as shown in the figure below. Look at the red arrow in the picture.
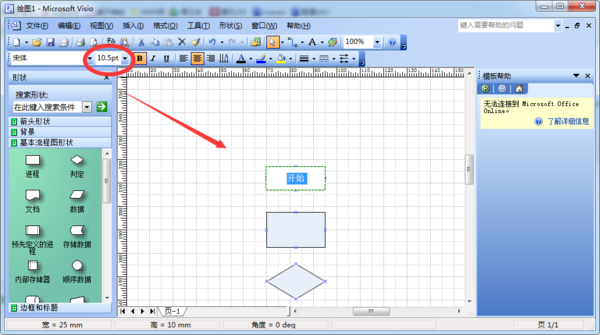
(6) Enter the required text in the dragged shape, double-click the shape and enter the text. The text is generally 10.5pt in size. The rounded rectangle is a terminal symbol, generally used to represent the start and end, the rectangle represents the process, and the diamond represents the judgment.
(7) Finally, use dynamic connecting lines to connect the shapes of the flow chart, and the flow chart is completed, as shown in the figure below.
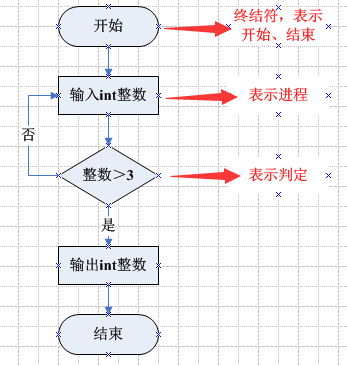
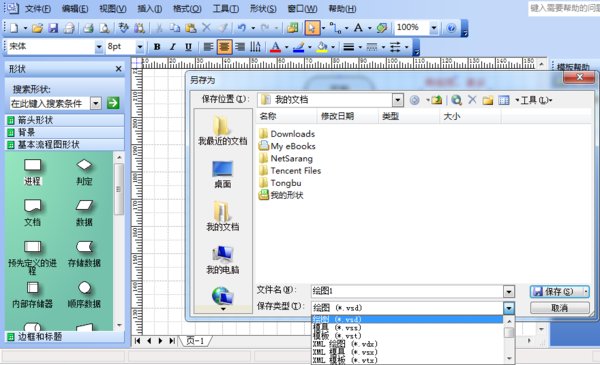
Note: The function represented by each shape of the flowchart is explained below the shape on the left. After the flowchart is drawn, click the [Save As] option to save the vsd file in the required format as shown below. .
How to use visio to draw a flow chart
Microsoft Visio can convert difficult-to-understand complex texts and tables into clear Visio diagrams, and can draw business process flow charts, network diagrams, workflow diagrams, database model diagrams, software diagrams, etc., with its exquisite drawing effects , is generally recognized.
Tools/Materials
microsoft office visio
Steps/Method
1 First, create a drawing, New-->Select drawing type-->Basic flow chart
2 Add the flow chart element - process, drag the icon process box into the blank space on the right,
3 Usually the process box is displayed in blue, change it to white, right-click and select Format-->Fill-->Select white
4 Another element of the flow chart, the processing of head cutting, click the head cutting on the left, drag it into the blank space, right-click Format-->Line-->Select black
5 These two elements are relatively basic. You can then copy and paste to get multiple process boxes and arrows, which is convenient to use. See the finished product picture
Precautions
During the drawing process, you can open an existing flow chart and copy it to a new drawing. This way, you don’t need to modify the lines and fill colors of each element, and you have all the necessary elements for the flow chart.
Many journals have requirements on text size. After setting the first box, you can use the format brush to process the others;
The drawing should be compact and the control is not good. You can enlarge the drawing before drawing, so that the drawn drawing can meet the layout requirements when used in journals.
The above is the detailed content of Steps to draw a mind map using Visio. For more information, please follow other related articles on the PHP Chinese website!

Hot AI Tools

Undresser.AI Undress
AI-powered app for creating realistic nude photos

AI Clothes Remover
Online AI tool for removing clothes from photos.

Undress AI Tool
Undress images for free

Clothoff.io
AI clothes remover

AI Hentai Generator
Generate AI Hentai for free.

Hot Article

Hot Tools

Notepad++7.3.1
Easy-to-use and free code editor

SublimeText3 Chinese version
Chinese version, very easy to use

Zend Studio 13.0.1
Powerful PHP integrated development environment

Dreamweaver CS6
Visual web development tools

SublimeText3 Mac version
God-level code editing software (SublimeText3)

Hot Topics
 How to Solve Windows Error Code "INVALID_DATA_ACCESS_TRAP" (0x00000004)
Mar 11, 2025 am 11:26 AM
This article addresses the Windows "INVALID_DATA_ACCESS_TRAP" (0x00000004) error, a critical BSOD. It explores common causes like faulty drivers, hardware malfunctions (RAM, hard drive), software conflicts, overclocking, and malware. Trou
 ENE SYS Maintenance: Tips and Tricks to Keep Your System Running Smoothly
Mar 07, 2025 pm 03:09 PM
This article provides practical tips for maintaining ENE SYS systems. It addresses common issues like overheating and data corruption, offering preventative measures such as regular cleaning, backups, and software updates. A tailored maintenance s
 How do I edit the Registry? (Warning: Use with caution!)
Mar 21, 2025 pm 07:46 PM
Article discusses editing Windows Registry, precautions, backup methods, and potential issues from incorrect edits. Main issue: risks of system instability and data loss from improper changes.
 How do I manage services in Windows?
Mar 21, 2025 pm 07:52 PM
Article discusses managing Windows services for system health, including starting, stopping, restarting services, and best practices for stability.
 5 Common Mistakes to Avoid During ENE SYS Implementation
Mar 07, 2025 pm 03:11 PM
This article identifies five common pitfalls in ENE SYS implementation: insufficient planning, inadequate user training, improper data migration, neglecting security, and insufficient testing. These errors can lead to project delays, system failures
 Discover How to Fix Drive Health Warning in Windows Settings
Mar 19, 2025 am 11:10 AM
What does the drive health warning in Windows Settings mean and what should you do when you receive the disk warning? Read this php.cn tutorial to get step-by-step instructions to cope with this situation.
 which application uses ene.sys
Mar 12, 2025 pm 01:25 PM
This article identifies ene.sys as a Realtek High Definition Audio driver component. It details its function in managing audio hardware, emphasizing its crucial role in audio functionality. The article also guides users on verifying its legitimacy
 why won't driver asio.sys load
Mar 10, 2025 pm 07:58 PM
This article addresses the failure of the Windows asio.sys audio driver. Common causes include corrupted system files, hardware/driver incompatibility, software conflicts, registry issues, and malware. Troubleshooting involves SFC scans, driver upda


