
 Technology peripherals
AI
On the relationship between similarity measures and distance measures
Technology peripherals
AI
On the relationship between similarity measures and distance measures
On the relationship between similarity measures and distance measures


In machine learning applications, similarity measurement is an indicator used to evaluate the similarity of two sample objects. Usually represented using distance measures, effective distance measures can improve the performance of machine learning models.
However, in terms of numerical relationship, the similarity measure and the distance measure are exactly the opposite.
The similarity measure is usually expressed as a numerical value. The higher the value, the more similar the data samples are. Generally, a number between 0 and 1 is used for conversion, where 0 indicates low similarity, that is, the data objects are not similar; and 1 indicates high similarity, indicating that the data objects are very similar.
Distance measure indicates that the similarity of data objects is inversely proportional to the distance value.
Commonly used distance measures
Euclidean Distance
That is, Euclidean distance Rider metric, which is the minimum distance between two points, is used by most machine learning algorithms to measure the similarity of observations.
Manhattan Distance
Manhattan distance is the total difference between two places in all dimensions. Because it is almost impossible to move in a straight line in the city, buildings are grouped into a grid that blocks straight paths. The term "Manhattan distance" is often used to refer to the distance between two city blocks.
Minkowski Distance
is the generalized form of Euclidean distance and Manhattan distance, defining two distance between observations.
Hamming Distance
The Hamming distance measures the similarity of two strings of the same length. Hamming distance is the number of points by which corresponding characters differ between two strings of the same length.
Cosine Distance(Cosine Similarity)
This indicator is widely used in text mining, natural language processing and information retrieval systems to measure two Similarity between given documents.
Chebyshev Distance(Chebyshev Distance)
The Chebyshev distance between two nD observations or vectors is equal to the data sample coordinates The maximum absolute value of the change. In the two-dimensional world, the Chebyshev distance between data points can be determined as the sum of the absolute differences of their two-dimensional coordinates.
Mahalanobis Distance
is mainly used for multivariate statistical testing to measure the distance between data points and distributions.
Chi-square Distance(Chi-square Distance)
Chi-square distance is often used in computer vision while performing texture analysis to find normalization The similarity between histograms is called "histogram matching".
Pearson Correlation
The Pearson correlation coefficient quantifies the strength of the linear monotonic relationship between two attributes and measures Whether the two data sets are on a line.
Spearman Correlation Coefficient
The Spearman correlation coefficient is a non-parametric indicator that measures the dependence of two variables. It uses a monotonic equation to evaluate the correlation between two statistical variables. Spearman correlation coefficient is often used for hypothesis testing.
The above is the detailed content of On the relationship between similarity measures and distance measures. For more information, please follow other related articles on the PHP Chinese website!

Hot AI Tools

Undresser.AI Undress
AI-powered app for creating realistic nude photos

AI Clothes Remover
Online AI tool for removing clothes from photos.

Undress AI Tool
Undress images for free

Clothoff.io
AI clothes remover

AI Hentai Generator
Generate AI Hentai for free.

Hot Article
Hot Tools

Notepad++7.3.1
Easy-to-use and free code editor

SublimeText3 Chinese version
Chinese version, very easy to use

Zend Studio 13.0.1
Powerful PHP integrated development environment

Dreamweaver CS6
Visual web development tools

SublimeText3 Mac version
God-level code editing software (SublimeText3)
Hot Topics


 15 recommended open source free image annotation tools
Mar 28, 2024 pm 01:21 PM
15 recommended open source free image annotation tools
Mar 28, 2024 pm 01:21 PM
Image annotation is the process of associating labels or descriptive information with images to give deeper meaning and explanation to the image content. This process is critical to machine learning, which helps train vision models to more accurately identify individual elements in images. By adding annotations to images, the computer can understand the semantics and context behind the images, thereby improving the ability to understand and analyze the image content. Image annotation has a wide range of applications, covering many fields, such as computer vision, natural language processing, and graph vision models. It has a wide range of applications, such as assisting vehicles in identifying obstacles on the road, and helping in the detection and diagnosis of diseases through medical image recognition. . This article mainly recommends some better open source and free image annotation tools. 1.Makesens
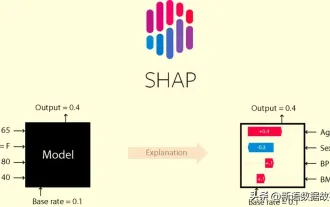 This article will take you to understand SHAP: model explanation for machine learning
Jun 01, 2024 am 10:58 AM
This article will take you to understand SHAP: model explanation for machine learning
Jun 01, 2024 am 10:58 AM
In the fields of machine learning and data science, model interpretability has always been a focus of researchers and practitioners. With the widespread application of complex models such as deep learning and ensemble methods, understanding the model's decision-making process has become particularly important. Explainable AI|XAI helps build trust and confidence in machine learning models by increasing the transparency of the model. Improving model transparency can be achieved through methods such as the widespread use of multiple complex models, as well as the decision-making processes used to explain the models. These methods include feature importance analysis, model prediction interval estimation, local interpretability algorithms, etc. Feature importance analysis can explain the decision-making process of a model by evaluating the degree of influence of the model on the input features. Model prediction interval estimate
 Transparent! An in-depth analysis of the principles of major machine learning models!
Apr 12, 2024 pm 05:55 PM
Transparent! An in-depth analysis of the principles of major machine learning models!
Apr 12, 2024 pm 05:55 PM
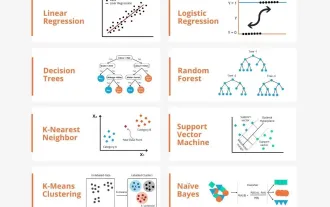
In layman’s terms, a machine learning model is a mathematical function that maps input data to a predicted output. More specifically, a machine learning model is a mathematical function that adjusts model parameters by learning from training data to minimize the error between the predicted output and the true label. There are many models in machine learning, such as logistic regression models, decision tree models, support vector machine models, etc. Each model has its applicable data types and problem types. At the same time, there are many commonalities between different models, or there is a hidden path for model evolution. Taking the connectionist perceptron as an example, by increasing the number of hidden layers of the perceptron, we can transform it into a deep neural network. If a kernel function is added to the perceptron, it can be converted into an SVM. this one
 Identify overfitting and underfitting through learning curves
Apr 29, 2024 pm 06:50 PM
Identify overfitting and underfitting through learning curves
Apr 29, 2024 pm 06:50 PM
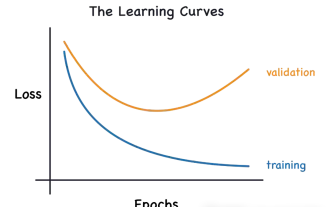
This article will introduce how to effectively identify overfitting and underfitting in machine learning models through learning curves. Underfitting and overfitting 1. Overfitting If a model is overtrained on the data so that it learns noise from it, then the model is said to be overfitting. An overfitted model learns every example so perfectly that it will misclassify an unseen/new example. For an overfitted model, we will get a perfect/near-perfect training set score and a terrible validation set/test score. Slightly modified: "Cause of overfitting: Use a complex model to solve a simple problem and extract noise from the data. Because a small data set as a training set may not represent the correct representation of all data." 2. Underfitting Heru
 The evolution of artificial intelligence in space exploration and human settlement engineering
Apr 29, 2024 pm 03:25 PM
The evolution of artificial intelligence in space exploration and human settlement engineering
Apr 29, 2024 pm 03:25 PM
In the 1950s, artificial intelligence (AI) was born. That's when researchers discovered that machines could perform human-like tasks, such as thinking. Later, in the 1960s, the U.S. Department of Defense funded artificial intelligence and established laboratories for further development. Researchers are finding applications for artificial intelligence in many areas, such as space exploration and survival in extreme environments. Space exploration is the study of the universe, which covers the entire universe beyond the earth. Space is classified as an extreme environment because its conditions are different from those on Earth. To survive in space, many factors must be considered and precautions must be taken. Scientists and researchers believe that exploring space and understanding the current state of everything can help understand how the universe works and prepare for potential environmental crises
 Implementing Machine Learning Algorithms in C++: Common Challenges and Solutions
Jun 03, 2024 pm 01:25 PM
Implementing Machine Learning Algorithms in C++: Common Challenges and Solutions
Jun 03, 2024 pm 01:25 PM
Common challenges faced by machine learning algorithms in C++ include memory management, multi-threading, performance optimization, and maintainability. Solutions include using smart pointers, modern threading libraries, SIMD instructions and third-party libraries, as well as following coding style guidelines and using automation tools. Practical cases show how to use the Eigen library to implement linear regression algorithms, effectively manage memory and use high-performance matrix operations.
 Explainable AI: Explaining complex AI/ML models
Jun 03, 2024 pm 10:08 PM
Explainable AI: Explaining complex AI/ML models
Jun 03, 2024 pm 10:08 PM
Translator | Reviewed by Li Rui | Chonglou Artificial intelligence (AI) and machine learning (ML) models are becoming increasingly complex today, and the output produced by these models is a black box – unable to be explained to stakeholders. Explainable AI (XAI) aims to solve this problem by enabling stakeholders to understand how these models work, ensuring they understand how these models actually make decisions, and ensuring transparency in AI systems, Trust and accountability to address this issue. This article explores various explainable artificial intelligence (XAI) techniques to illustrate their underlying principles. Several reasons why explainable AI is crucial Trust and transparency: For AI systems to be widely accepted and trusted, users need to understand how decisions are made
 Outlook on future trends of Golang technology in machine learning
May 08, 2024 am 10:15 AM
Outlook on future trends of Golang technology in machine learning
May 08, 2024 am 10:15 AM
The application potential of Go language in the field of machine learning is huge. Its advantages are: Concurrency: It supports parallel programming and is suitable for computationally intensive operations in machine learning tasks. Efficiency: The garbage collector and language features ensure that the code is efficient, even when processing large data sets. Ease of use: The syntax is concise, making it easy to learn and write machine learning applications.
