

Hello everyone, I am Michuan
Without artificial intelligence, we need to spend at least 60 minutes reading the code and manually drawing mind maps based on our own understanding. Or flowchart to help us understand the code better.
AI can convert the code into accurate code visualization graphics, saving time reading the code, only 5 minutes.
There are three problems here:
1. How to interpret the code through AI
2. How to present the interpreted code through a flow chart?
3. How to generate a flow chart
I will introduce these three parts in sequence
AI interpretation code actually uses AI Summarize capabilities and generate code comments. Large models already implement this functionality.
For example, the underlying model of Baidu Comate: Wenxinyiyan 4.0, the CodeGeex large model developed by Tsinghua University, and the underlying model of GitHub Copilot: CodeX
Some people may ask, why not through GPT What about generating comments directly?
GPT is a general large model that can do many things, such as writing articles, writing code, writing novels, etc.; if you only write code, it is not as good as the large proprietary code model, which is more specialized and only focuses on the code field. Interpreting the code is more accurate, and the generated code comments are more accurate
Here is an example of using Comate to interpret the code:
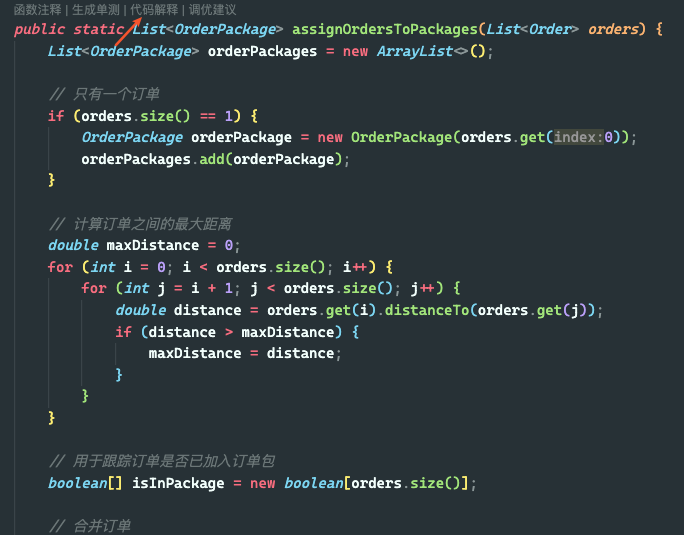
For example, the following code has 200 lines, and the core is order packaging, such as 10 After the orders are clustered, 8 packages are generated
There are too many details in the clustering. I want to use AI to extract and draw the flow chart, which is more intuitive. First, use the AI programming tool Baidu Comate to interpret this code
After installing the plug-in Comate, above the function code, find the code explanation menu
 Picture
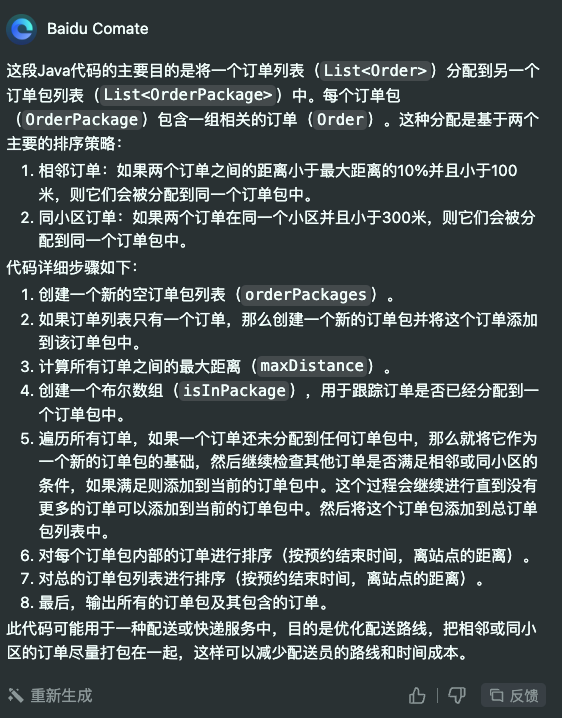
Click the code comment and the Baidu AI Assistant chat box will open. Show code explanation
 Picture
Whether you are reporting to the leader or writing a weekly report, if you can Text or code visualization will immediately give people a different feeling, so it is very important to learn visualization
Code visualization generally requires the creation of UML diagrams. There are many such tools, ranging from using text descriptions to generate UML diagrams In terms of perspective, I chose PlantUML
PlantUML is a powerful tool for quickly creating many types of diagrams. These diagrams are widely used in software development and document writing. The following are some of the main diagram types supported by PlantUML:
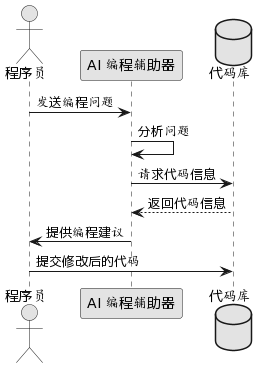
1. Sequence Diagram: used to display time series of interactions between objects, commonly used Demonstrates message passing between components or objects within the system.
 Picture
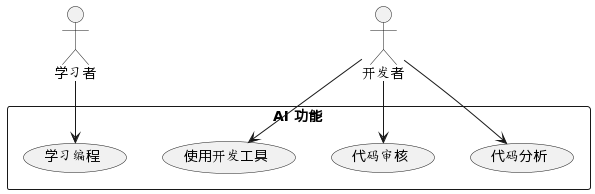
2. Use Case Diagram: Describes the interaction between the system’s functions and external users (participants).
 Picture
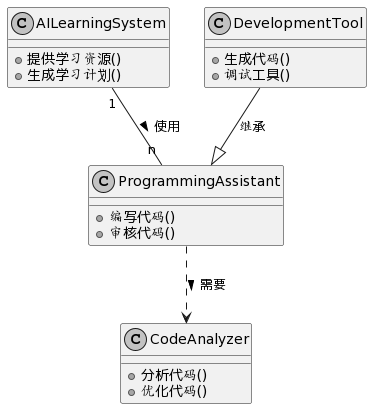
3. Class Diagram: Shows the structure of classes in the system and the relationships between classes, such as inheritance, interface implementation, Dependencies, etc.
 Picture
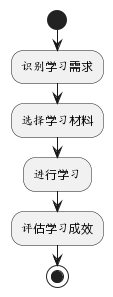
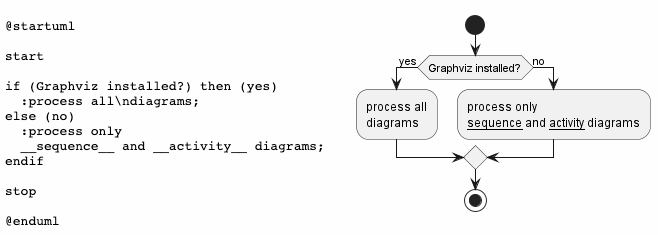
4. Activity Diagram: Similar to a flow chart, used to show the flow of control from one activity to another.
 Picture
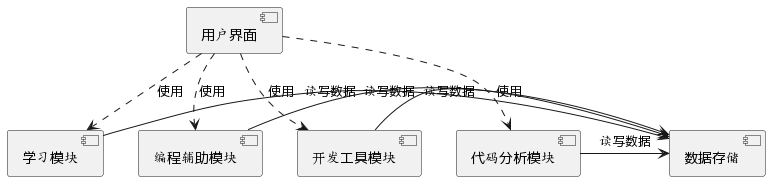
5. Component Diagram: Shows how the components of the system work together.
 Picture
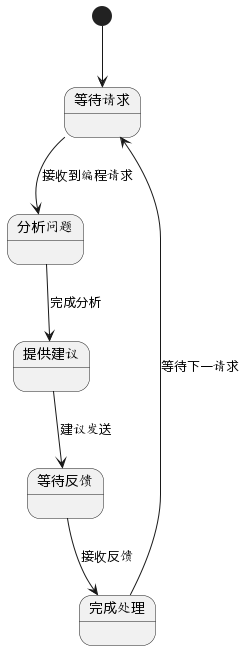
6. State Diagram: Shows the states an object experiences during its life cycle and the transitions between states.
 Picture
7. Object Diagram: An example of a class diagram, showing the relationship between objects in the system.
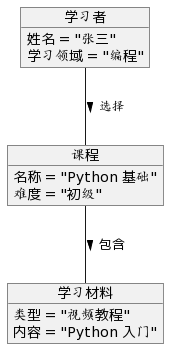 Picture
8. Package Diagram: Shows the package structure of the code, which helps to understand the modular organization of the code.
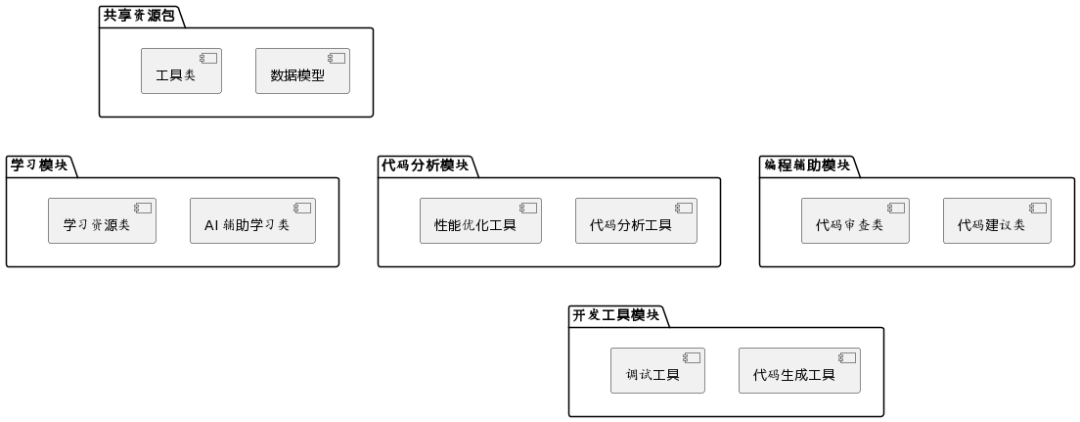 Picture
9. Organization chart (Wireframe Graphic Interface): used to describe the composition of the graphic organizational structure
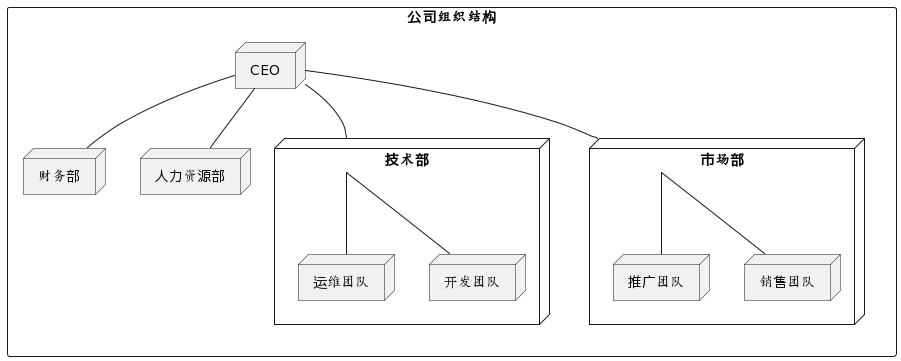 Picture
10. Gantt Diagram: used in project management to show the project timeline and progress.
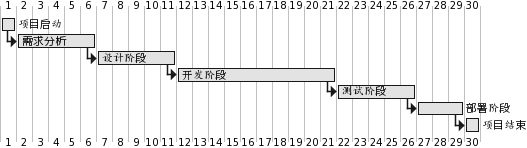 Picture
I don’t know if you have noticed it, but I don’t seem to have seen the flow chart. In fact, the activity diagram in PlantUML is a flow chart, and the code syntax is on the left. On the right is a visual graphic
 Picture
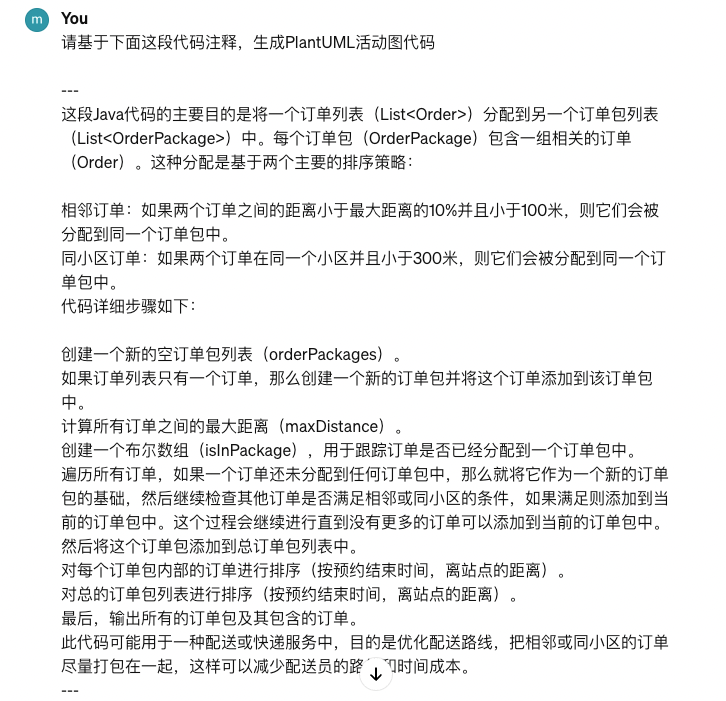
We generated code comments through the AI programming tool, and then asked the AI about the code comments obtained: Please base on the following Comment on this code to generate PlantUML activity diagram code
 Picture
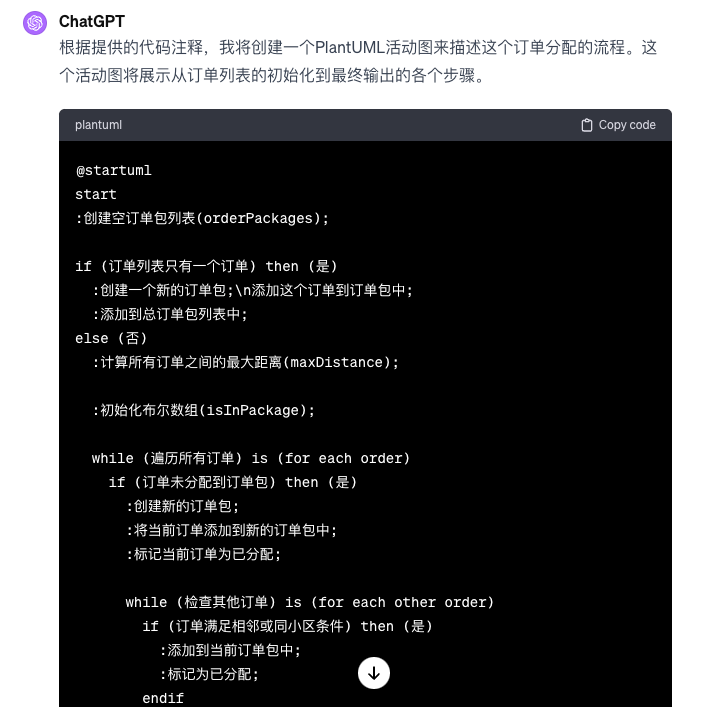
Look at AI’s reply:
 Picture
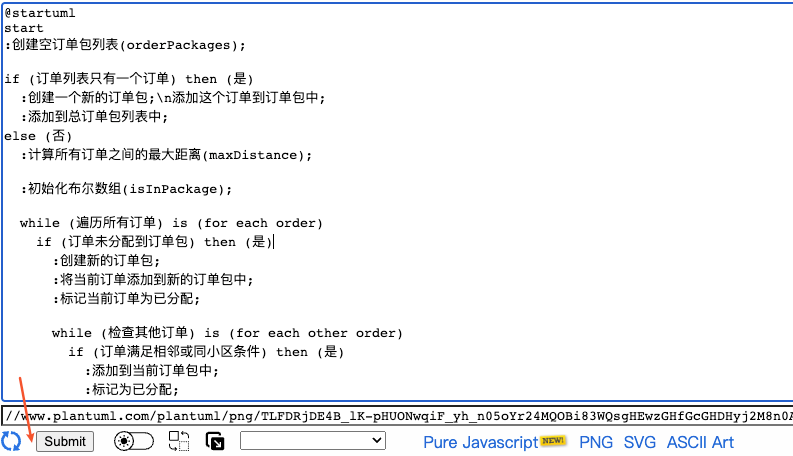
Copy the flow chart code generated in step 2 to the plantuml visualization website URL: http://www.plantuml.com/plantuml
 Picture
Click the Submit button to get the picture
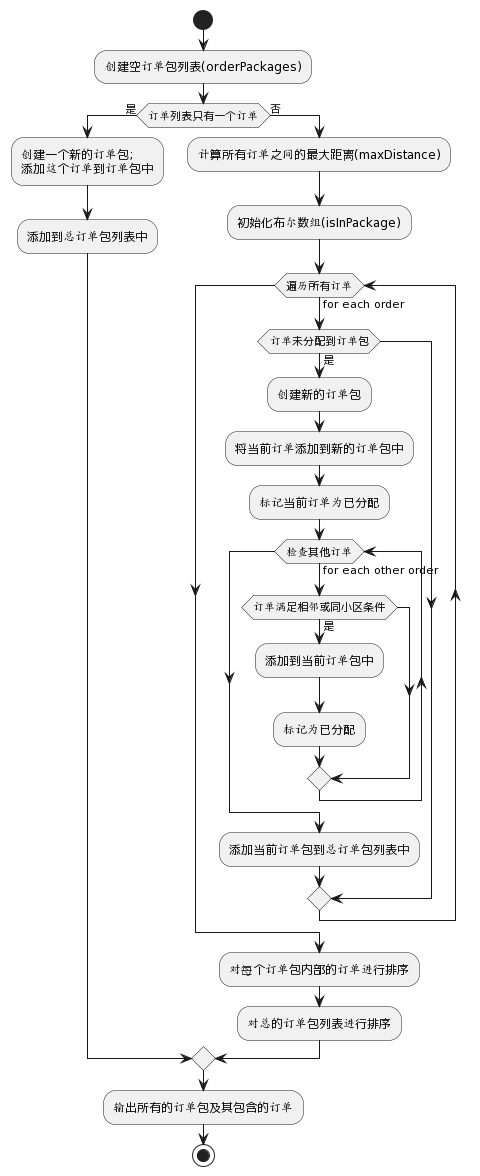 Picture
You can roughly know the meaning of this code by looking at the flow chart. AI interprets the code visualization diagram, which is really convenient
The above is through the code-> Comment-> ; The method of drawing a flow chart can achieve the desired effect. Compared with the traditional method of manually drawing graphics after reading the code, it is indeed much more efficient.
Finally, let me share a little tip: the visual presentation of the code is There are many kinds. Why does it have to be a flow chart instead of other types of diagrams? You can ask AI which diagram is better to generate with this code and choose the optimal presentation method for visualization
For example, based on the above code, I can also generate Class diagram
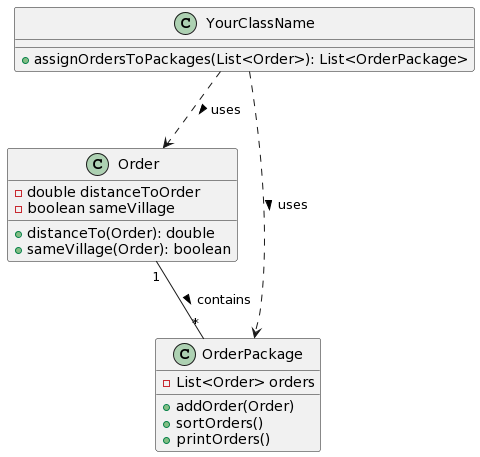 Picture
I have generated a lot of diagrams like this. For example, I mainly write about Go. I have written many articles and then use AI has been visualized
For example, Go can reentrant lock, and a picture explains it in an easy-to-understand manner
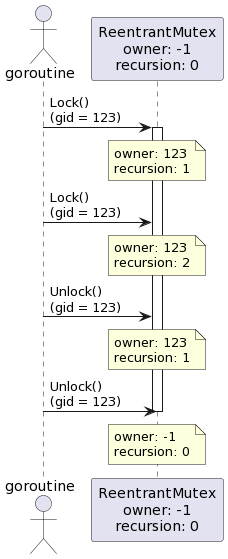 Picture
For example, Go memory management , a picture explains the memory distribution components
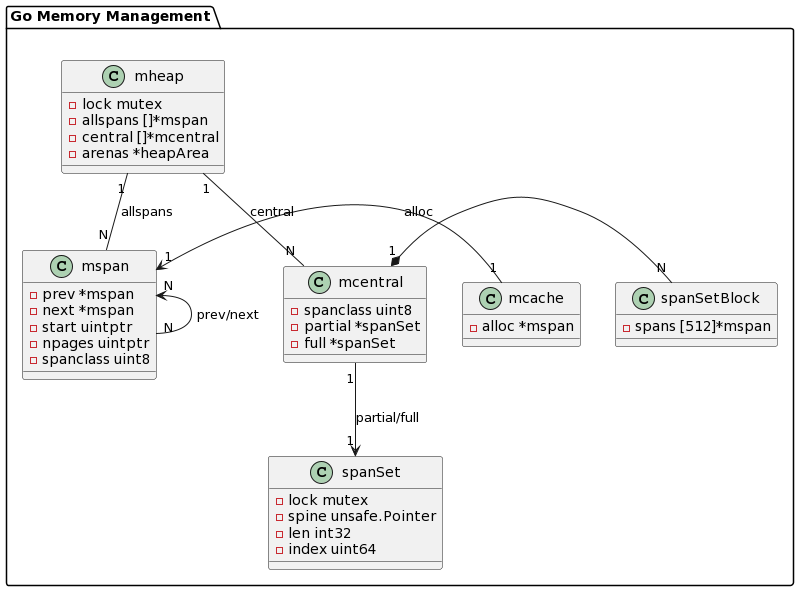 Picture
For example, go.sum file, a picture describes the internal structure
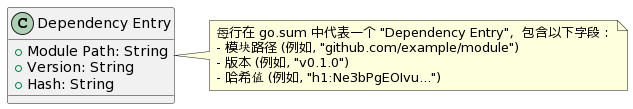 Picture
For example, the underlying data structure of sync.Cond, a picture illustrates the provided function interface
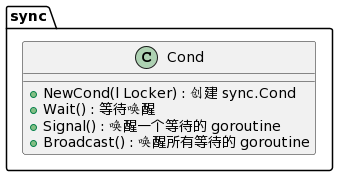 Picture
The above pictures are all generated using AI. AI can allow people who do not understand programming to complete the development of a tool or plug-in, greatly reducing the cost of software development; AI can allow people who understand programming to complete daily tasks more efficiently. Work, complete application development faster, greatly improving work and study efficiency
I have always adhered to a point of view: if you can’t write, you can’t write with AI; if you can’t program, you can’t Able to program AI.
If you want to generate a code flow chart through AI, you must first know what a code flow chart is, what are the ways to visualize it, and then use AI to accelerate the process.
That’s it for today’s sharing. There are still many scenarios where AI can be used to improve efficiency. I will share it with you next time I have the opportunity. Thank you all for taking the time to watch.
The above is the detailed content of How AI accurately generates stunning code flow charts. For more information, please follow other related articles on the PHP Chinese website!
 Introduction to the usage of vbs whole code
 The speed difference between usb2.0 and 3.0
 How to save programs written in pycharm
 How to represent negative numbers in binary
 Linux compression zip command usage
 Why does my phone keep restarting?
 What are the commonly used functions of informix?
 The difference between sqlserver and mysql
 Solutions to unknown software exception exceptions in computer applications


![[Web front-end] Node.js quick start](https://img.php.cn/upload/course/000/000/067/662b5d34ba7c0227.png)


