

Summary of methods to check memory usage under Linux

Q: I have a question, I want to monitor the memory usage of my Linux system. What views or command line tools are available under Linux?
A: In Linux systems, there are many ways to monitor memory usage. Here are some ways to view memory usage through view tools or the command line.
-
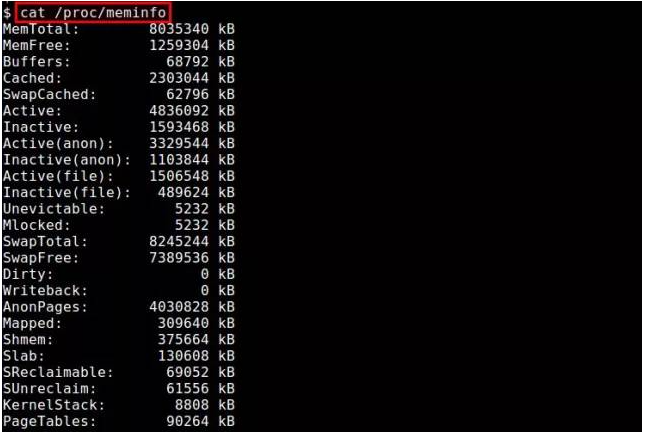
/proc/meminfo: The easiest way is to look at the/proc/meminfofile. This virtual file updates dynamically and provides detailed information about memory usage. It lists various memory metrics to cover most of your memory usage needs. In addition, you can also view the memory usage information of the process through/proc/<pid>/statm</pid>and/proc/<pid>/status</pid>. -
freeCommand: This command can display the memory usage in the system, including used memory, free memory, cache and swap space, etc. You can use thefree -hcommand to display memory usage in a human-readable way. -
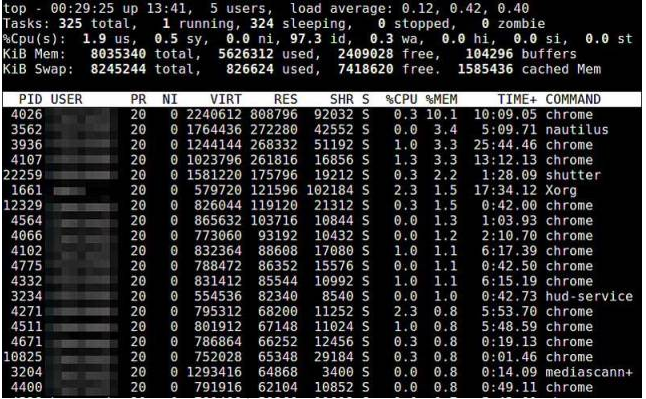
topCommand:topThe command can display various performance indicators of the system in real time, including memory usage. You can use thetopcommand and press theShift mkey to sort processes by memory usage. -
htopTool:htopis an interactive process viewing tool that can display various performance indicators of the system, including memory usage, in a more friendly way. You can use thesudo apt install htopcommand to install and runhtop. -
glancesTool:glancesis a versatile system monitoring tool that can summarize and display various performance indicators of the system, including memory usage. You can use thesudo apt install glancescommand to install and runglances.
These tools and commands provide different ways to monitor the memory usage of Linux systems. You can choose the appropriate tool to use according to your needs. Hope this information is helpful to you!
$ cat /proc/meminfoCopy after login
2.atop
atop command is a terminal environment monitoring command. It shows a combination of various system resources (CPU, memory, network, I/O, kernel) and is color-coded under high load conditions.
$ sudo atopCopy after login

3.free
The free command is a quick way to view memory usage. It is an overview of the information collected by /proc/meminfo.
$ free -hCopy after login

4.GNOME System Monitor
GNOME System Monitor is a view tool that displays the usage of CPU, memory, swap area and network in the recent period. It also provides a way to view CPU and memory usage.
$ gnome-system-monitorCopy after login

5.htop
The htop command displays the real-time memory usage of each process. It provides reports on the resident memory size of all processes, total program memory size, shared library size, etc. The list can be scrolled horizontally and vertically.
$ htopCopy after login

6.KDE System Monitor
The functions are the same as the GENOME version introduced in 4.
$ ksysguardCopy after login

7.memstat
memstat is a command that effectively identifies the use of virtual memory by executable(s), process(es) and shared libraries. Given a process ID, memstat can list the executable files, data and shared libraries associated with this process.
$ memstat -pCopy after login

8.nmon
nmon是一个基于ncurses的系统基准测试工具,它可以监控CPU、内存、I/O、文件系统及网络资源等的互动模式。对于内存的使用,它可以实时的显示 总/剩余内存、交换空间等信息。
$ nmonCopy after login

9.ps
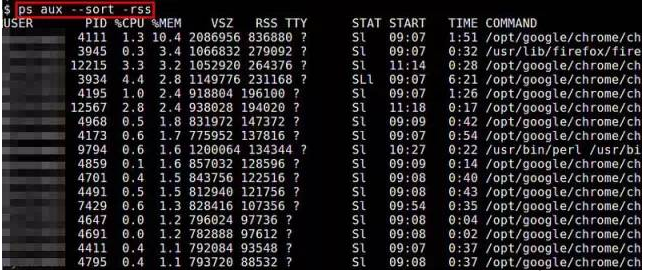
ps命令可以实时的显示各个进程的内存使用情况。Reported memory usage information includes %MEM (percent of physical memory used), VSZ (total amount of virtual memory used), and RSS (total amount of physical memory used)。你可以使用 “–sort”选项对进程进行排序,例如按RSS进行排序:
$ ps aux --sort -rssCopy after login
10.smem
smem命令允许你统计基于/proc信息的不同进程和用户的内存使用情况。内存使用情况的分析可以导出图表(如条形图和饼图)。
$ sudo smem --pie name -c "pss"Copy after login

11.top
top命令提供了实时的运行中的程序的资源使用统计。你可以根据内存的使用和大小来进行排序。
$ topCopy after login
12.vmstat
vmstat命令显示实时的和平均的统计,覆盖CPU、内存、I/O等内容。例如内存情况,不仅显示物理内存,也统计虚拟内存。
$ vmstat -sCopy after login
The above is the detailed content of Summary of methods to check memory usage under Linux. For more information, please follow other related articles on the PHP Chinese website!

Hot AI Tools

Undresser.AI Undress
AI-powered app for creating realistic nude photos

AI Clothes Remover
Online AI tool for removing clothes from photos.

Undress AI Tool
Undress images for free

Clothoff.io
AI clothes remover

Video Face Swap
Swap faces in any video effortlessly with our completely free AI face swap tool!

Hot Article
Hot Tools

Notepad++7.3.1
Easy-to-use and free code editor

SublimeText3 Chinese version
Chinese version, very easy to use

Zend Studio 13.0.1
Powerful PHP integrated development environment

Dreamweaver CS6
Visual web development tools

SublimeText3 Mac version
God-level code editing software (SublimeText3)
Hot Topics
 1387
1387
 52
52

 How to use docker desktop
Apr 15, 2025 am 11:45 AM
How to use docker desktop
Apr 15, 2025 am 11:45 AM
How to use Docker Desktop? Docker Desktop is a tool for running Docker containers on local machines. The steps to use include: 1. Install Docker Desktop; 2. Start Docker Desktop; 3. Create Docker image (using Dockerfile); 4. Build Docker image (using docker build); 5. Run Docker container (using docker run).
 How to view the docker process
Apr 15, 2025 am 11:48 AM
How to view the docker process
Apr 15, 2025 am 11:48 AM
Docker process viewing method: 1. Docker CLI command: docker ps; 2. Systemd CLI command: systemctl status docker; 3. Docker Compose CLI command: docker-compose ps; 4. Process Explorer (Windows); 5. /proc directory (Linux).
 What to do if the docker image fails
Apr 15, 2025 am 11:21 AM
What to do if the docker image fails
Apr 15, 2025 am 11:21 AM
Troubleshooting steps for failed Docker image build: Check Dockerfile syntax and dependency version. Check if the build context contains the required source code and dependencies. View the build log for error details. Use the --target option to build a hierarchical phase to identify failure points. Make sure to use the latest version of Docker engine. Build the image with --t [image-name]:debug mode to debug the problem. Check disk space and make sure it is sufficient. Disable SELinux to prevent interference with the build process. Ask community platforms for help, provide Dockerfiles and build log descriptions for more specific suggestions.
 What computer configuration is required for vscode
Apr 15, 2025 pm 09:48 PM
What computer configuration is required for vscode
Apr 15, 2025 pm 09:48 PM
VS Code system requirements: Operating system: Windows 10 and above, macOS 10.12 and above, Linux distribution processor: minimum 1.6 GHz, recommended 2.0 GHz and above memory: minimum 512 MB, recommended 4 GB and above storage space: minimum 250 MB, recommended 1 GB and above other requirements: stable network connection, Xorg/Wayland (Linux)
 vscode cannot install extension
Apr 15, 2025 pm 07:18 PM
vscode cannot install extension
Apr 15, 2025 pm 07:18 PM
The reasons for the installation of VS Code extensions may be: network instability, insufficient permissions, system compatibility issues, VS Code version is too old, antivirus software or firewall interference. By checking network connections, permissions, log files, updating VS Code, disabling security software, and restarting VS Code or computers, you can gradually troubleshoot and resolve issues.
 Can vscode be used for mac
Apr 15, 2025 pm 07:36 PM
Can vscode be used for mac
Apr 15, 2025 pm 07:36 PM
VS Code is available on Mac. It has powerful extensions, Git integration, terminal and debugger, and also offers a wealth of setup options. However, for particularly large projects or highly professional development, VS Code may have performance or functional limitations.
 What is vscode What is vscode for?
Apr 15, 2025 pm 06:45 PM
What is vscode What is vscode for?
Apr 15, 2025 pm 06:45 PM
VS Code is the full name Visual Studio Code, which is a free and open source cross-platform code editor and development environment developed by Microsoft. It supports a wide range of programming languages and provides syntax highlighting, code automatic completion, code snippets and smart prompts to improve development efficiency. Through a rich extension ecosystem, users can add extensions to specific needs and languages, such as debuggers, code formatting tools, and Git integrations. VS Code also includes an intuitive debugger that helps quickly find and resolve bugs in your code.
 How to back up vscode settings and extensions
Apr 15, 2025 pm 05:18 PM
How to back up vscode settings and extensions
Apr 15, 2025 pm 05:18 PM
How to back up VS Code configurations and extensions? Manually backup the settings file: Copy the key JSON files (settings.json, keybindings.json, extensions.json) to a safe location. Take advantage of VS Code synchronization: enable synchronization with your GitHub account to automatically back up all relevant settings and extensions. Use third-party tools: Back up configurations with reliable tools and provide richer features such as version control and incremental backups.
