Linux development coredump file analysis practical sharing
Foreword:
In embedded Linux development, analyzing coredump files is a common method, and we can often find related usage tutorials on the Internet. However, there are few articles on how to analyze coredump files of multi-threaded applications. Today I will share some cases that I encountered in actual use, hoping to provide some help to everyone. Due to code and space limitations, I will only describe the problems that I think are more distinctive, and use framework thinking to solve many coredump file situations encountered.
Author: Conscience Still Remains
Reprint authorization and onlookers: Welcome to follow the WeChat public account: 半妖
Or add the author’s personal WeChat: become_me
Plot introduction:
When debugging a function, I generated some coredump files, and different program errors occurred. Through this opportunity, I would like to share it with everyone. Generally speaking, coredump files may be generated due to null pointers, array out-of-bounds, multiple releases by multiple threads, stack overflow, etc. Here I have selected some representative problems based on the situations I encountered and share with you some simple solutions.
First of all, to debug accordingly, we need to use the gdb tool. Before starting to analyze the coredump file, you need to be familiar with the various commands of gdb. The following are two articles I wrote before about gdb debugging:
One article to get started with gdb debugging under Linux (1)
Introduction to gdb debugging under Linux in one article (2)
Therefore, this article will not go into details on these contents, but only focuses on the actual operations we need to perform when analyzing coredump files.
First, we need to use the executable file with debugging information for debugging.
gdb executable_file coredump_file
Example 1: Pointer initialization failed
The first thing after entering is to use the bt command to view the stack information

In this coredump file, we can easily see that there is an obvious data difference between the incoming address of a function and the class member function. We can directly make a conclusion on such an obvious part and then check the details.
f n
Select the frame by frame number. The frame number can be viewed through the bt command.
我们查看对应的第 17帧的堆栈信息

通过上面截图我们可以看到在第17帧中 this这个类实体化的地址出现了问题。
为了对比我们又查看了对应20帧的堆栈信息以及对应帧的详细信息

然后我们需要确认该指针是什么什么出现问题的,进行第20帧数据的详细查看。其中我们用p命令查看该类下面的对应的和17帧this的关系,确认gyro_在这个函数执行的时候,地址是否正确。


从上面来看在此处函数执行的时候,对应的gyro的地址还没有变成错误的0x1388。
从这里我们基本可以确认到,函数从 第20帧对应位置执行之后再到17帧的函数的时候,执行函数的地址发生了改变 然后开始进入校对代码的环节。
这个时候校对不是看代码执行的具体情况,因为发生问题的部分已经是被修改了指针地址。所以我们需要从全局去看这个实体类被进行实体化和释放操作的地方。
最终找到了一个出现线程调用先后顺序导致变量没有准备好,出现的死机情况。
示例二:另一个指针问题
进入之后第一件事情 使用 bt命令查看堆栈信息
这个coredump文件在使用bt命令之后发现 此处的堆栈信息看上去都很正常,无法显示出代码在哪里了出现了问题。

这个时候我们就要考虑多线程时候,堆栈信息不一定直接捕获到对应线程,我们需要打开所有线程里面的堆栈信息。
thread apply all bt
除了bt大家也可以打印自己需要的其他信息
thread apply all command //所有线程都执行命令
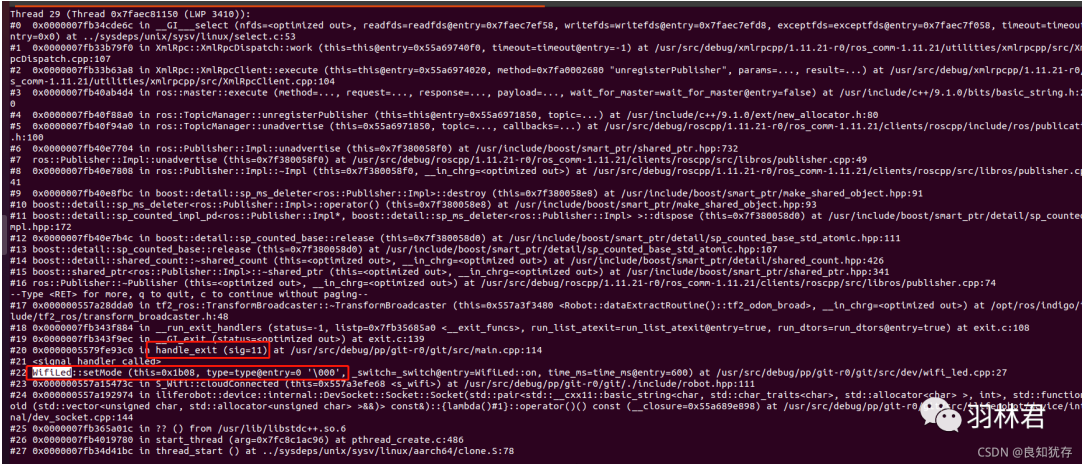
对应打印出所有线程的堆栈信息之后,我们就进行一点点查看,但是如果你的代码定义了 信号处理函数,例如我使用了 handle_exit进行处理,然后我就在所有线程堆栈信息里面去搜索对应最后面信号处理的函数,再往回查看程序执行的过程。
此时我们发现led一个实体化类的的初始地址出现了问题,最后校验代码,发现了这个bug。
示例三:内存溢出
进入之后第一件事情 使用 bt命令查看堆栈信息
此时发现当前堆栈信息也无法进行定位到问题。

Then we used thread apply all bt But the first time we didn’t see the corresponding hand_exit function
Then we use info locals to view the saved local variable information
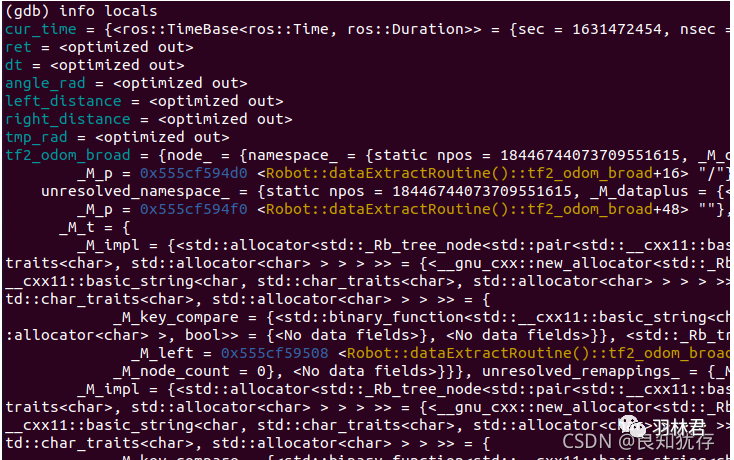
info f addrPrint the information of the frame specified by addr.info argsPrint the value of the function variable.
info localsPrint information about local variables.
info catchPrint out the exception handling information in the current function.
Local variables do not have any obvious indication of pointer errors or data out-of-bounds displays.
So we use the p command to print the variable information saved in the frame information.
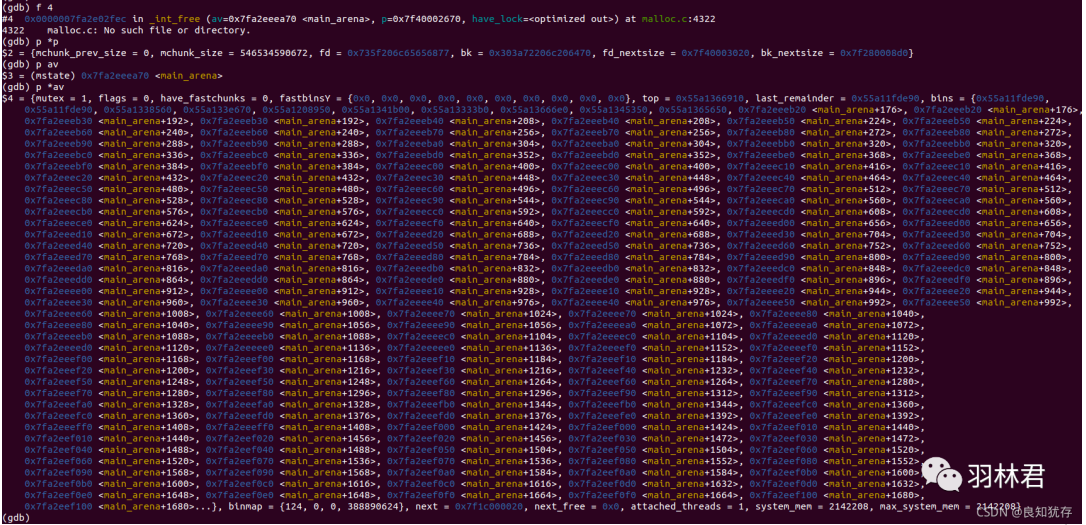
By printing these variable information that we think have a high error rate, we can assist us in making judgments. However, there is no way to confirm the location of the problem with this printing.
Then we re-look at the stack information of all threads. Finally, I saw an abnormal parameter. This value was very large and somewhat abnormal.
Next we check the corresponding source code location. Because it is a C library, we directly look at the code in the compilation location.

Look at the information displayed in frame 7 firststl_algobase.h:465
After opening the corresponding code location, we found that the **__n** parameter is the parameter for the amount of allocated space.
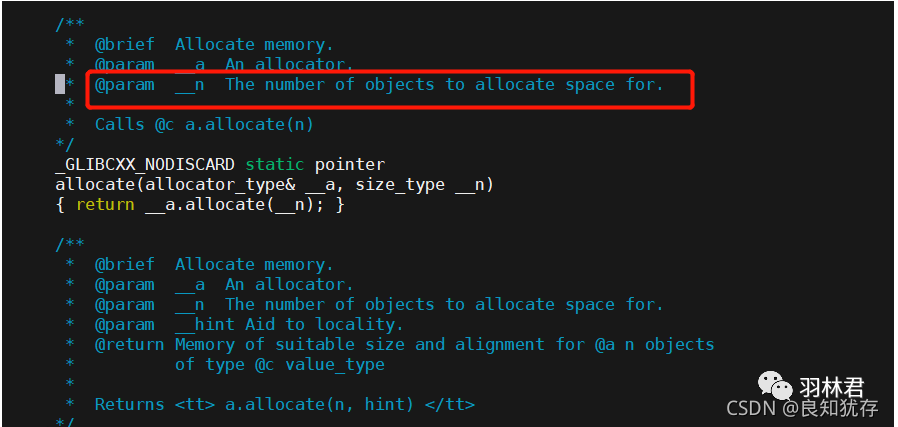
Check again before and after execution stl_vector.h:343
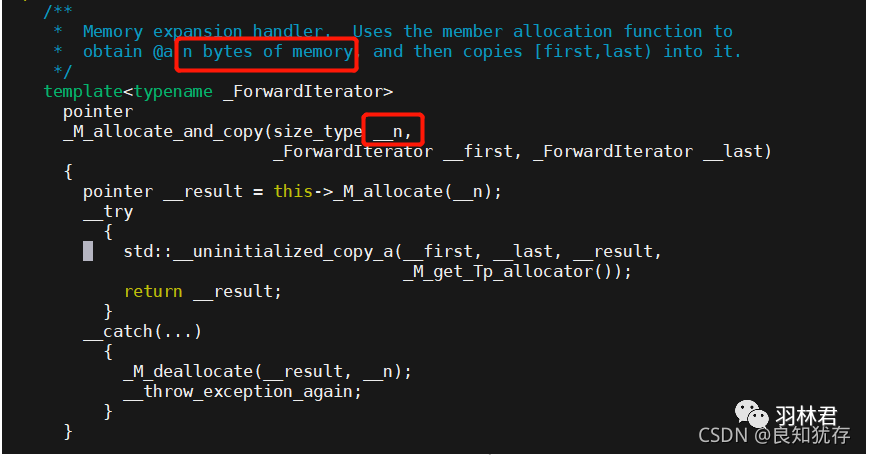
The __n passed in now is approximately a unit value greater than 100 million, and the actual working location of the code does not require such a large space allocation. So it is confirmed that there is a problem here. After comparing the location of code execution and the global usage of the corresponding variables, it is basically determined that the queue is used by multiple threads and the lock is not used properly, resulting in multiple threads in extreme circumstances, output and input operations. It will be done in the same area, causing the code to crash this time.
Conclusion
This is the analysis of coredump files in the project I shared. If you have better ideas and needs, you are welcome to add me as a friend to communicate and share.
In addition to the commands used in my article, you can also use more commands to assist gbd debugging to check our coredump file. For example, view assembly code and so on. There are still many articles about gdb debugging commands on the Internet. You can also read other articles to help you use the commands.
The above is the detailed content of Linux development coredump file analysis practical sharing. For more information, please follow other related articles on the PHP Chinese website!

Hot AI Tools

Undresser.AI Undress
AI-powered app for creating realistic nude photos

AI Clothes Remover
Online AI tool for removing clothes from photos.

Undress AI Tool
Undress images for free

Clothoff.io
AI clothes remover

AI Hentai Generator
Generate AI Hentai for free.

Hot Article

Hot Tools

Notepad++7.3.1
Easy-to-use and free code editor

SublimeText3 Chinese version
Chinese version, very easy to use

Zend Studio 13.0.1
Powerful PHP integrated development environment

Dreamweaver CS6
Visual web development tools

SublimeText3 Mac version
God-level code editing software (SublimeText3)

Hot Topics
 1380
1380
 52
52
 Difference between centos and ubuntu
Apr 14, 2025 pm 09:09 PM
The key differences between CentOS and Ubuntu are: origin (CentOS originates from Red Hat, for enterprises; Ubuntu originates from Debian, for individuals), package management (CentOS uses yum, focusing on stability; Ubuntu uses apt, for high update frequency), support cycle (CentOS provides 10 years of support, Ubuntu provides 5 years of LTS support), community support (CentOS focuses on stability, Ubuntu provides a wide range of tutorials and documents), uses (CentOS is biased towards servers, Ubuntu is suitable for servers and desktops), other differences include installation simplicity (CentOS is thin)
 How to install centos
Apr 14, 2025 pm 09:03 PM
CentOS installation steps: Download the ISO image and burn bootable media; boot and select the installation source; select the language and keyboard layout; configure the network; partition the hard disk; set the system clock; create the root user; select the software package; start the installation; restart and boot from the hard disk after the installation is completed.
 Centos stops maintenance 2024
Apr 14, 2025 pm 08:39 PM
CentOS will be shut down in 2024 because its upstream distribution, RHEL 8, has been shut down. This shutdown will affect the CentOS 8 system, preventing it from continuing to receive updates. Users should plan for migration, and recommended options include CentOS Stream, AlmaLinux, and Rocky Linux to keep the system safe and stable.
 Detailed explanation of docker principle
Apr 14, 2025 pm 11:57 PM
Docker uses Linux kernel features to provide an efficient and isolated application running environment. Its working principle is as follows: 1. The mirror is used as a read-only template, which contains everything you need to run the application; 2. The Union File System (UnionFS) stacks multiple file systems, only storing the differences, saving space and speeding up; 3. The daemon manages the mirrors and containers, and the client uses them for interaction; 4. Namespaces and cgroups implement container isolation and resource limitations; 5. Multiple network modes support container interconnection. Only by understanding these core concepts can you better utilize Docker.
 Centos options after stopping maintenance
Apr 14, 2025 pm 08:51 PM
CentOS has been discontinued, alternatives include: 1. Rocky Linux (best compatibility); 2. AlmaLinux (compatible with CentOS); 3. Ubuntu Server (configuration required); 4. Red Hat Enterprise Linux (commercial version, paid license); 5. Oracle Linux (compatible with CentOS and RHEL). When migrating, considerations are: compatibility, availability, support, cost, and community support.
 What to do after centos stops maintenance
Apr 14, 2025 pm 08:48 PM
After CentOS is stopped, users can take the following measures to deal with it: Select a compatible distribution: such as AlmaLinux, Rocky Linux, and CentOS Stream. Migrate to commercial distributions: such as Red Hat Enterprise Linux, Oracle Linux. Upgrade to CentOS 9 Stream: Rolling distribution, providing the latest technology. Select other Linux distributions: such as Ubuntu, Debian. Evaluate other options such as containers, virtual machines, or cloud platforms.
 How to use docker desktop
Apr 15, 2025 am 11:45 AM
How to use Docker Desktop? Docker Desktop is a tool for running Docker containers on local machines. The steps to use include: 1. Install Docker Desktop; 2. Start Docker Desktop; 3. Create Docker image (using Dockerfile); 4. Build Docker image (using docker build); 5. Run Docker container (using docker run).
 vscode cannot install extension
Apr 15, 2025 pm 07:18 PM
The reasons for the installation of VS Code extensions may be: network instability, insufficient permissions, system compatibility issues, VS Code version is too old, antivirus software or firewall interference. By checking network connections, permissions, log files, updating VS Code, disabling security software, and restarting VS Code or computers, you can gradually troubleshoot and resolve issues.


