
 Technology peripherals
AI
Three papers solve the problem of 'Optimization and Evaluation of Semantic Segmentation'! Leuven/Tsinghua/Oxford and others jointly proposed a new method
Technology peripherals
AI
Three papers solve the problem of 'Optimization and Evaluation of Semantic Segmentation'! Leuven/Tsinghua/Oxford and others jointly proposed a new method
Three papers solve the problem of 'Optimization and Evaluation of Semantic Segmentation'! Leuven/Tsinghua/Oxford and others jointly proposed a new method

Commonly used loss functions for optimizing semantic segmentation models include Soft Jaccard loss, Soft Dice loss and Soft Tversky loss. However, these loss functions are incompatible with soft labels and therefore cannot support some important training techniques such as label smoothing, knowledge distillation, semi-supervised learning, and multiple annotators. These training techniques are very important to improve the performance and robustness of semantic segmentation models, so further research and optimization of loss functions are needed to support the application of these training techniques.
On the other hand, commonly used semantic segmentation evaluation indicators include mAcc and mIoU. However, these indicators have a preference for larger objects, which seriously affects the safety performance evaluation of the model.
To solve these problems, researchers at the University of Leuven and Tsinghua first proposed the JDT loss. JDT loss is a fine-tuning of the original loss function, which includes Jaccard Metric loss, Dice Semimetric loss and Compatible Tversky loss. The JDT loss is equivalent to the original loss function when dealing with hard labels, and is also fully applicable to soft labels. This improvement makes model training more accurate and stable.
The researchers successfully applied the JDT loss in four important scenarios: label smoothing, knowledge distillation, semi-supervised learning, and multiple annotators. These applications demonstrate the power of the JDT loss to improve model accuracy and calibration.
 Picture
Paper link: https://arxiv.org/pdf/2302.05666.pdf
 Picture
Paper link: https://arxiv.org/pdf/2303.16296.pdf
In addition, researchers also proposed fine-grained evaluation indicators. These fine-grained evaluation metrics are less biased against large-sized objects, provide richer statistical information, and can provide valuable insights for model and dataset auditing.
Moreover, the researchers conducted an extensive benchmark study that emphasized the need for evaluation not to be based on a single metric and discovered the important role of neural network structure and JDT loss in optimizing fine-grained metrics.
 Picture
Paper link: https://arxiv.org/pdf/2310.19252.pdf
Code link: https://github.com/zifuwanggg/JDTLosses
Existing loss function
Since Jaccard Index and Dice Score are defined on the set, So it's not directable. In order to make them differentiable, there are currently two common approaches: one is to use the relationship between the set and the Lp module of the corresponding vector, such as Soft Jaccard loss (SJL), Soft Dice loss (SDL) and Soft Tversky loss (STL). ).
They write the size of the set as the L1 module of the corresponding vector, and write the intersection of two sets as the inner product of the two corresponding vectors. The other is to use the submodular property of Jaccard Index to do Lovasz expansion on the set function, such as Lovasz-Softmax loss (LSL).
 Picture
These loss functions assume that the output x of the neural network is a continuous vector, The label y is a discrete binary vector. If the label is a soft label, that is, when y is no longer a discrete binary vector, but a continuous vector, these loss functions are no longer compatible.
Taking SJL as an example, consider a simple single-pixel situation:
 Picture
It can be found that for any y > 0, SJL will be minimized when x = 1 and maximized when x = 0. Since a loss function should be minimized when x = y, this is obviously unreasonable.
Loss function compatible with soft labels
In order to make the original loss function compatible with soft labels, it is necessary to calculate the intersection and union of two sets, Introduce the symmetric difference between the two sets:
 Picture
Note that the symmetric difference between the two sets can Written as the L1 module of the difference between two corresponding vectors:
 Picture
Putting the above together, we proposed the JDT loss. They are a variant of SJL, Jaccard Metric loss (JML), a variant of SDL, Dice Semimetric loss (DML), and a variant of STL, Compatible Tversky loss (CTL).
 Picture
Nature of JDT loss
We proved that JDT loss has Some of the following properties.
Property 1: JML is a metric, and DML is a semimetric.
Property 2: When y is a hard label, JML is equivalent to SJL, DML is equivalent to SDL, and CTL is equivalent to STL.
Property 3: When y is a soft label, JML, DML, and CTL are all compatible with soft labels, that is, x = y ó f(x, y) = 0.
Due to Property 1, they are also called Jaccard Metric loss and Dice Semimetric loss. Property 2 shows that in general scenarios where only hard labels are used for training, JDT loss can be directly used to replace the existing loss function without causing any changes.
How to use JDT loss
We have conducted a lot of experiments and summarized some precautions for using JDT loss.
Note 1: Select the corresponding loss function based on the evaluation index. If the evaluation index is Jaccard Index, then JML should be selected; if the evaluation index is Dice Score, then DML should be selected; if you want to give different weights to false positives and false negatives, then CTL should be selected. Secondly, when optimizing fine-grained evaluation indicators, the JDT loss should also be changed accordingly.
Note 2: Combine JDT loss and pixel-level loss function (such as Cross Entropy loss, Focal loss). This article found that 0.25CE 0.75JDT is generally a good choice.
Note 3: It is best to use a shorter epoch for training. After adding the JDT loss, it generally only requires half the epochs of the Cross Entropy loss training.
Note 4: When performing distributed training on multiple GPUs, if there is no additional communication between GPUs, the JDT loss will incorrectly optimize fine-grained evaluation metrics, resulting in The effect becomes worse on traditional mIoU.
Note 5: When training on an extreme category imbalanced data set, it should be noted that the JDL loss is calculated separately on each category and then averaged, which may cause Training becomes erratic.
Experimental results
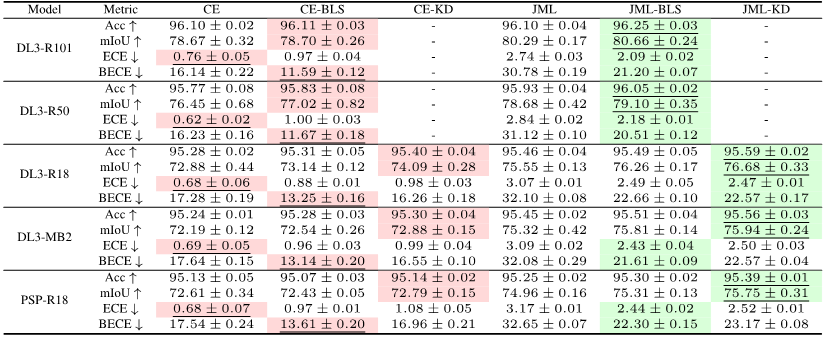
The experiment proves that compared with the baseline of Cross Entropy loss, adding JDT loss can effectively improve the accuracy of the model when training with hard labels. . The accuracy and calibration of the model can be further improved by introducing soft labels.
 Picture
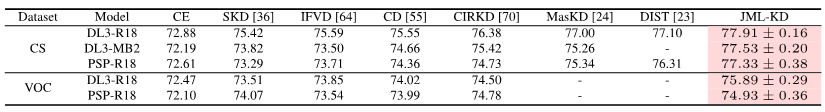
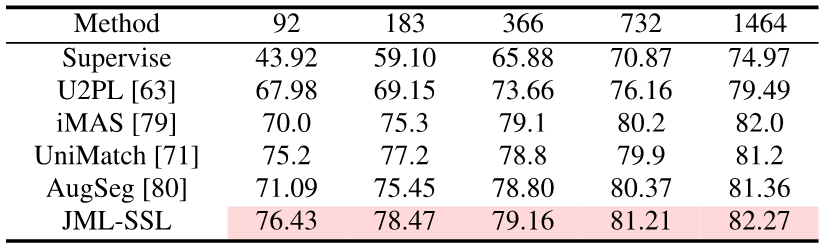
Only adding the JDT loss term during training, this article has achieved semantic segmentation Knowledge distillation, semi-supervised learning and multi-annotator SOTA.
 Image] [image
 Picture
Existing evaluation indicators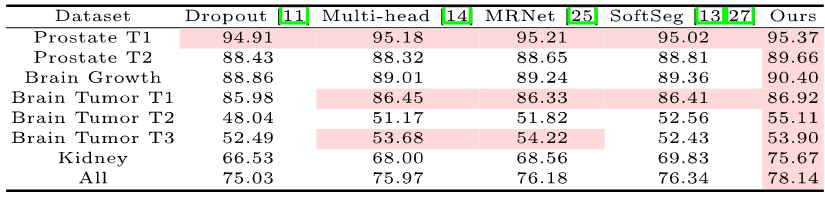 Semantic segmentation is a pixel-level classification task, so The accuracy of each pixel can be calculated: overall pixel-wise accuracy (Acc). However, because Acc will be biased towards the majority category, PASCAL VOC 2007 adopts an evaluation index that calculates the pixel accuracy of each category separately and then averages it: mean pixel-wise accuracy (mAcc).
 Picture
In order to calculate mIoUD, we first need to count for each category c the trueness of all I photos in the entire data set positive (TP), false positive (FP) and false negative (FN):
 ##Picture
 Picture

##Fine-grained evaluation indicators
In order to solve the problem of mIoUD, we propose a fine-grained evaluation index. These metrics calculate IoU on each photo separately, which can effectively reduce the preference for large-sized objects.
mIoUI
For each category c, we calculate an IoU on each photo i:
Picture
Next, for each photo i, we average all categories that have appeared in this photo :
Picture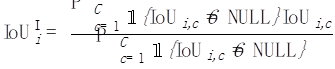
Finally, we average the values of all the photos:
Picture
mIoUC
Similarly, after calculating After the IoU of each category c on each photo i, we can average all the photos in which each category c appears:

Finally, average the values of all categories:

Because not all categories will appear on all photos, so for some combinations of categories and photos, NULL values will appear, as shown in the figure below. When calculating mIoUI, the categories are averaged first and then the photos are averaged, while when mIoUC is calculated, the photos are averaged first and then the categories are averaged.
The result is that mIoUI may be biased towards categories that appear frequently (such as C1 in the figure below), which is generally not good. But on the other hand, when calculating mIoUI, because each photo has an IoU value, this can help us do some auditing and analysis of the model and data set.
Picture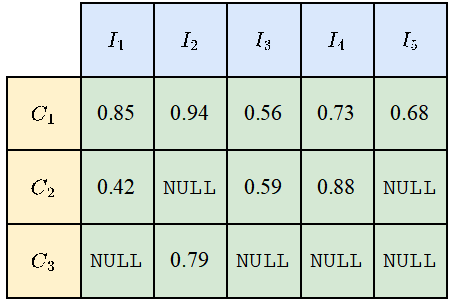
Worst case evaluation index
For some application scenarios that pay great attention to security, we are often more concerned about the worst-case segmentation quality, and one benefit of fine-grained indicators is that they can calculate the corresponding worst-case indicators. Let's take mIoUC as an example. A similar method can also calculate the corresponding worst-case indicator of mIoUI.
For each category c, we first sort the IoU values of all the photos it has appeared in (assuming there are Ic such photos) in ascending order. Next, we set q to be a small number, such as 1 or 5. Then, we only use the top Ic * q% of the sorted photos to calculate the final value:
 Pictures
After having the value of each class c, we can average by class as before to get the worst-case indicator of mIoUC.
Experimental results
We trained 15 models on 12 data sets and discovered the following phenomena.
Phenomenon 1: No model can achieve the best results on all evaluation indicators. Each evaluation index has a different focus, so we need to consider multiple evaluation indexes at the same time to conduct a comprehensive evaluation.
Phenomenon 2: There are some photos in some data sets that cause almost all models to achieve a very low IoU value. This is partly because the photos themselves are very challenging, such as some very small objects and strong contrast between light and dark, and partly because there are problems with the labels of these photos. Therefore, fine-grained evaluation metrics can help us conduct model audits (finding scenarios where models make mistakes) and dataset audits (finding wrong labels).
Phenomenon 3: The structure of the neural network plays a crucial role in optimizing fine-grained evaluation indicators. On the one hand, the improvement in the receptive field brought by structures such as ASPP (adopted by DeepLabV3 and DeepLabV3) can help the model recognize large-sized objects, thereby effectively improving the value of mIoUD; on the other hand, the gap between encoder and decoder Long connections (adopted by UNet and DeepLabV3) enable the model to recognize small-sized objects, thereby improving the value of fine-grained evaluation indicators.
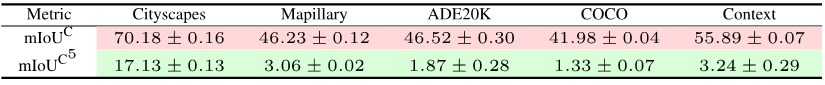
Phenomenon 4: The value of the worst-case indicator is far lower than the value of the corresponding average indicator. The following table shows the mIoUC and corresponding worst-case indicator values of DeepLabV3-ResNet101 on multiple data sets. A question worth considering in the future is, how should we design the neural network structure and optimization method to improve the model's performance under the worst-case indicators?
 Picture
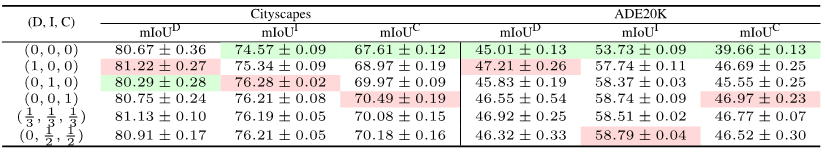
Phenomenon 5: Loss function is crucial to optimizing fine-grained evaluation indicators role. Compared with the Cross Entropy loss benchmark, as shown in (0, 0, 0) in the following table, when the evaluation indicators become fine-grained, using the corresponding loss function can greatly improve the model's performance on fine-grained evaluation indicators. For example, on ADE20K, the difference in mIoUC loss between JML and Cross Entropy will be greater than 7%.
 Picture
Future work
We only considered JDT loss as semantics loss functions for segmentation, but they can also be applied to other tasks, such as traditional classification tasks.
Secondly, JDT losses are only used in label space, but we believe that they can be used to minimize the distance between any two vectors in feature space, for example, to replace Lp module and cosine distance.
References:
https://arxiv.org/pdf/2302.05666.pdf
https://arxiv.org/pdf/ 2303.16296.pdf
https://arxiv.org/pdf/2310.19252.pdf
The above is the detailed content of Three papers solve the problem of 'Optimization and Evaluation of Semantic Segmentation'! Leuven/Tsinghua/Oxford and others jointly proposed a new method. For more information, please follow other related articles on the PHP Chinese website!

Hot AI Tools

Undresser.AI Undress
AI-powered app for creating realistic nude photos

AI Clothes Remover
Online AI tool for removing clothes from photos.

Undress AI Tool
Undress images for free

Clothoff.io
AI clothes remover

Video Face Swap
Swap faces in any video effortlessly with our completely free AI face swap tool!

Hot Article
Hot Tools

Notepad++7.3.1
Easy-to-use and free code editor

SublimeText3 Chinese version
Chinese version, very easy to use

Zend Studio 13.0.1
Powerful PHP integrated development environment

Dreamweaver CS6
Visual web development tools

SublimeText3 Mac version
God-level code editing software (SublimeText3)
Hot Topics
 1386
1386
 52
52

 Domestic open source MoE indicators explode: GPT-4 level capabilities, API price is only one percent
May 07, 2024 pm 05:34 PM
Domestic open source MoE indicators explode: GPT-4 level capabilities, API price is only one percent
May 07, 2024 pm 05:34 PM
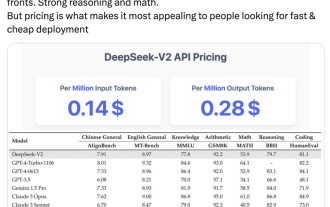
The latest large-scale domestic open source MoE model has become popular just after its debut. The performance of DeepSeek-V2 reaches GPT-4 level, but it is open source, free for commercial use, and the API price is only one percent of GPT-4-Turbo. Therefore, as soon as it was released, it immediately triggered a lot of discussion. Judging from the published performance indicators, DeepSeekV2's comprehensive Chinese capabilities surpass those of many open source models. At the same time, closed source models such as GPT-4Turbo and Wenkuai 4.0 are also in the first echelon. The comprehensive English ability is also in the same first echelon as LLaMA3-70B, and surpasses Mixtral8x22B, which is also a MoE. It also shows good performance in knowledge, mathematics, reasoning, programming, etc. And supports 128K context. Picture this
 Ten commonly used loss function explanations and Python code implementations
Apr 13, 2023 am 09:37 AM
Ten commonly used loss function explanations and Python code implementations
Apr 13, 2023 am 09:37 AM
What is a loss function? The loss function is an algorithm that measures how well the model fits the data. A loss function is a way of measuring the difference between actual measurements and predicted values. The higher the value of the loss function, the more incorrect the prediction is, and the lower the value of the loss function, the closer the prediction is to the true value. The loss function is calculated for each individual observation (data point). The function that averages the values of all loss functions is called the cost function. A simpler understanding is that the loss function is for a single sample, while the cost function is for all samples. Loss functions and metrics Some loss functions can also be used as evaluation metrics. But loss functions and metrics have different purposes. Although
 Commonly used loss functions and Python implementation examples
Apr 26, 2023 pm 01:40 PM
Commonly used loss functions and Python implementation examples
Apr 26, 2023 pm 01:40 PM
What is a loss function? The loss function is an algorithm that measures how well the model fits the data. A loss function is a way of measuring the difference between actual measurements and predicted values. The higher the value of the loss function, the more incorrect the prediction is, and the lower the value of the loss function, the closer the prediction is to the true value. The loss function is calculated for each individual observation (data point). The function that averages the values of all loss functions is called the cost function. A simpler understanding is that the loss function is for a single sample, and the cost function is for all samples. Loss functions and metrics Some loss functions can also be used as evaluation metrics. But loss functions and metrics have different purposes. Although the measurement
 Semantic segmentation and video concept detection technology and applications in video content understanding implemented in Java
Jun 18, 2023 pm 07:51 PM
Semantic segmentation and video concept detection technology and applications in video content understanding implemented in Java
Jun 18, 2023 pm 07:51 PM
In today's digital video era, video content understanding technology plays an important role in various fields, such as video recommendation, video search, automatic video annotation, etc. Among them, semantic segmentation and video concept detection technology are the two main aspects of video content understanding. This article will start from the perspective of Java implementation and introduce the basic concepts of semantic segmentation and video concept detection technology and their value in practical applications. 1. Semantic segmentation technology Semantic segmentation technology is an important research direction in the field of computer vision. Its purpose is to perform pixel-level analysis of images or videos.
 From Metrics to Practice: How to Improve PHP Code by Measuring Software Metrics with PHPDepend
Sep 15, 2023 am 09:33 AM
From Metrics to Practice: How to Improve PHP Code by Measuring Software Metrics with PHPDepend
Sep 15, 2023 am 09:33 AM
From Metrics to Practice: How to Use PHPDepend to Measure Software Metrics to Improve PHP Code Introduction: In the software development process, the evaluation of code quality is crucial. By measuring various software metrics, we can better understand the quality and performance of the code, and then take appropriate measures to improve the code. This article will introduce how to use the PHPDepend tool to measure various indicators of PHP code, and use specific code examples to demonstrate how to improve the code based on the measurement results. Metrics Measurement for PHP CodePHPDep
 Pixel-level accuracy issues in semantic segmentation
Oct 09, 2023 am 08:13 AM
Pixel-level accuracy issues in semantic segmentation
Oct 09, 2023 am 08:13 AM
Semantic segmentation is an important task in the field of computer vision that aims to assign each pixel in an image to a specific semantic category. In semantic segmentation, pixel-level accuracy is an important indicator, which measures whether the model's classification of each pixel is accurate. However, in practical applications, we often face the problem of low accuracy. This article discusses the issue of pixel-level accuracy in semantic segmentation and provides some concrete code examples. First, we need to understand the basic principles of semantic segmentation. Commonly used semantic segmentation models include FCN
 Is the altcoin market about to experience an 'explosive rebound”? It is enough to pay attention to these three indicators
Jun 03, 2024 pm 05:15 PM
Is the altcoin market about to experience an 'explosive rebound”? It is enough to pay attention to these three indicators
Jun 03, 2024 pm 05:15 PM
Cryptocurrency traders who closely monitor three technical indicators say that the altcoin market is currently in an "incredible phase" and may soon enter an "explosive rally phase" if history repeats itself. Cryptocurrency analyst MikybullCrypto told their 66,600X followers in a post on May 11: “Altcoin market caps are currently at an incredible stage, and historically, explosive rallies have followed.” Skeptical The phase is when despite positive market signs, investors remain skeptical, as reflected in the massive 24-point drop in the Crypto Fear and Greed Index over the past 30 days. Currently&ldq
 An in-depth explanation of the technology operation indicator system
Jun 08, 2023 pm 06:43 PM
An in-depth explanation of the technology operation indicator system
Jun 08, 2023 pm 06:43 PM
Introduction When it comes to technology operation indicators, every technology person can name a few, such as transaction volume, response time, response rate, success rate, etc. These metrics are quantitative assessments of work in an area of operations. However, in order to evaluate the overall level of technology operations, it is necessary to establish an indicator system for technology operations, obtain overall information, and then use this information to drive the development of operations and achieve organizational goals. Construction Goals and Positioning Bank G has established a technology operation observability index system to provide managers with a multi-dimensional and refined operation management analysis framework, and use this as a starting point to improve the center's operation management capabilities, decision-making level and service quality. The construction of the indicator system follows the four principles of being quantifiable, comparable, action-oriented, and adaptable to multiple scenarios, focusing on actual business scenarios.
