
nvtop command is a great task monitor for Linux users that monitors NVIDIA, AMD and Intel GPU (graphics processing unit) usage. It is similar to the top command or htop command and can efficiently handle multiple GPUs in your system and display detailed information about them in htop format.
Next let’s take a look at how to install the nvtop command and monitor GPU tasks on your Linux distribution.
The nvtop command is a GPU status viewer based on ncurses (the new curses library that displays information in the terminal) for AMD, Intel and NVIDIA GPUs. In other words, you can use this interactive GPU process viewer on Linux to view the status of the following GPUs:
You can also install the nvtop command on the GPU desktop or server depending on your Linux distribution.
Arch Linux
Run the following pacman command:
$ sudo pacman -Syu nvtop
Gentoo Linux
Use the following emerge command:
linuxmi@linuxmi:~/www.linuxmi.com$ sudo layman -a guru
linuxmi@linuxmi:~/www.linuxmi.com$ sudo emerge -av nvtop
Ubuntu Impish (21.10), Debian Buster (stable) and newer versions
Try using apt command or apt-get command:
linuxmi@linuxmi:~/www.linuxmi.com$ sudo apt update
linuxmi@linuxmi:~/www.linuxmi.com$ sudo apt install nvtop
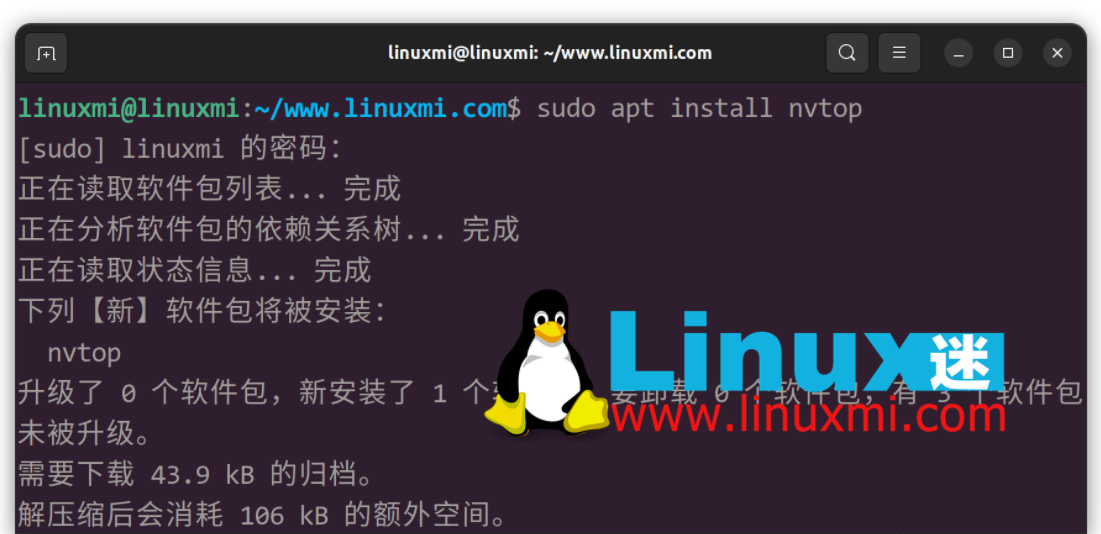
Debian Linux 10 users please enable contrib software sources in /etc/apt/sources.list:
deb http://deb.debian.org/debian buster main non-free contrib
deb http://deb.debian.org/debian buster-updates main non-free contrib
deb http://deb.debian.org/debian-security/ buster/updates main non-free contrib
Then search for it using apt-cache command and install it using sudo apt install nvtop command:
linuxmi@linuxmi:~/www.linuxmi.com$ sudo apt update
linuxmi@linuxmi:~/www.linuxmi.com$ sudo apt search nvtop
linuxmi@linuxmi:~/www.linuxmi.com$ sudo apt-cache policy nvtop
All other Linux distributions
Try using the snap command. For example:
linuxmi@linuxmi:~/www.linuxmi.com$ snap search nvtop
linuxmi@linuxmi:~/www.linuxmi.com$ sudo snap install nvtop
Next, add the function to kill GPU processes in nvtop:
linuxmi@linuxmi:~/www.linuxmi.com$ sudo snap connect nvtop:process-control
You can also easily add the ability to view GPU information (fans, PCIe, power supplies, etc.) as follows:
linuxmi@linuxmi:~/www.linuxmi.com$ sudo snap connect nvtop:hardware-observe
Here's how to add AMD GPU process list support:
linuxmi@linuxmi:~/www.linuxmi.com$sudo snap connect nvtop:system-observe
You may need a workaround to get per-process GPU usage. For example:
linuxmi@linuxmi:~/www.linuxmi.com$ sudo snap connect nvtop:kubernetes-support
How to use Docker nvtop image
Please try the following commands in a Linux terminal. You must have a working Docker installation. For example:
linuxmi@linuxmi:~/www.linuxmi.com$git clone https://github.com/Syllo/nvtop.git
linuxmi@linuxmi:~/www.linuxmi.com$cd nvtop
linuxmi@linuxmi:~/www.linuxmi.com/nvtop$ sudo docker build --tag nvtop .
linuxmi@linuxmi:~/www.linuxmi.com/nvtop$ sudo docker run -it --rm --runtime=nvidia --gpus=all --pid=host nvtop
Now that the tool is installed, it’s time to try it out. You just need to enter the following command:
linuxmi@linuxmi:~/www.linuxmi.com$ nvtop
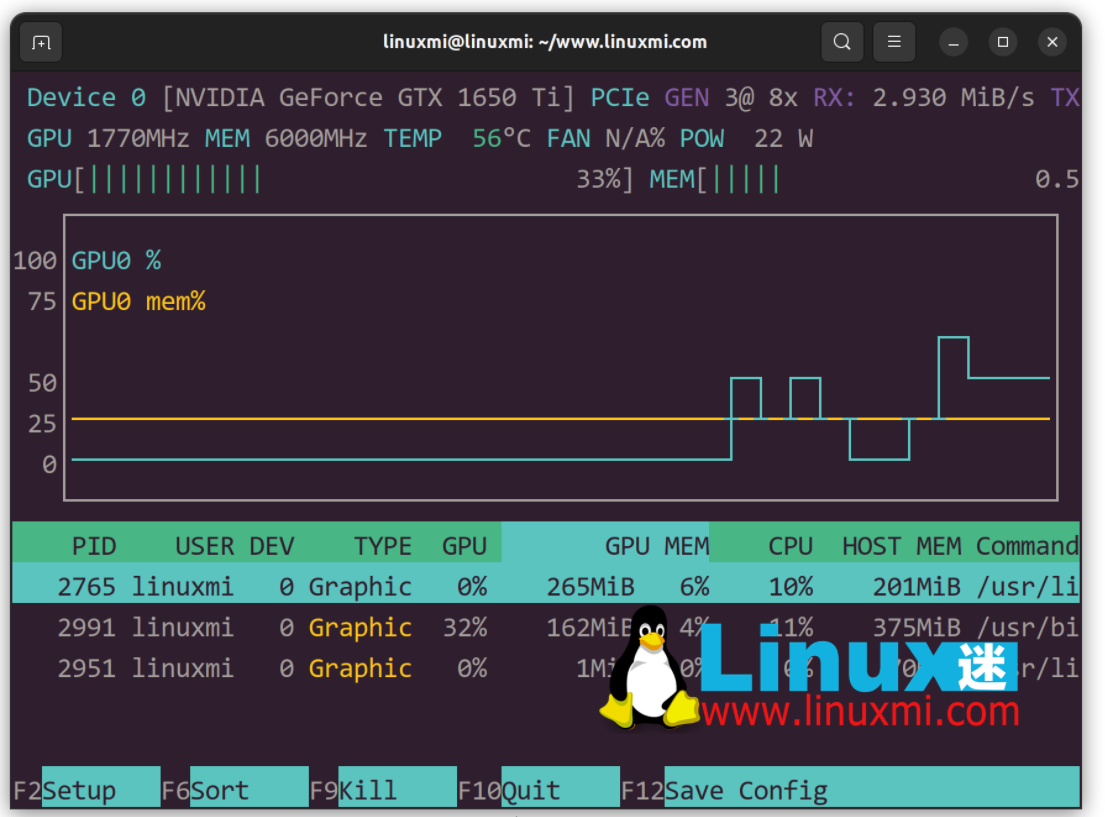
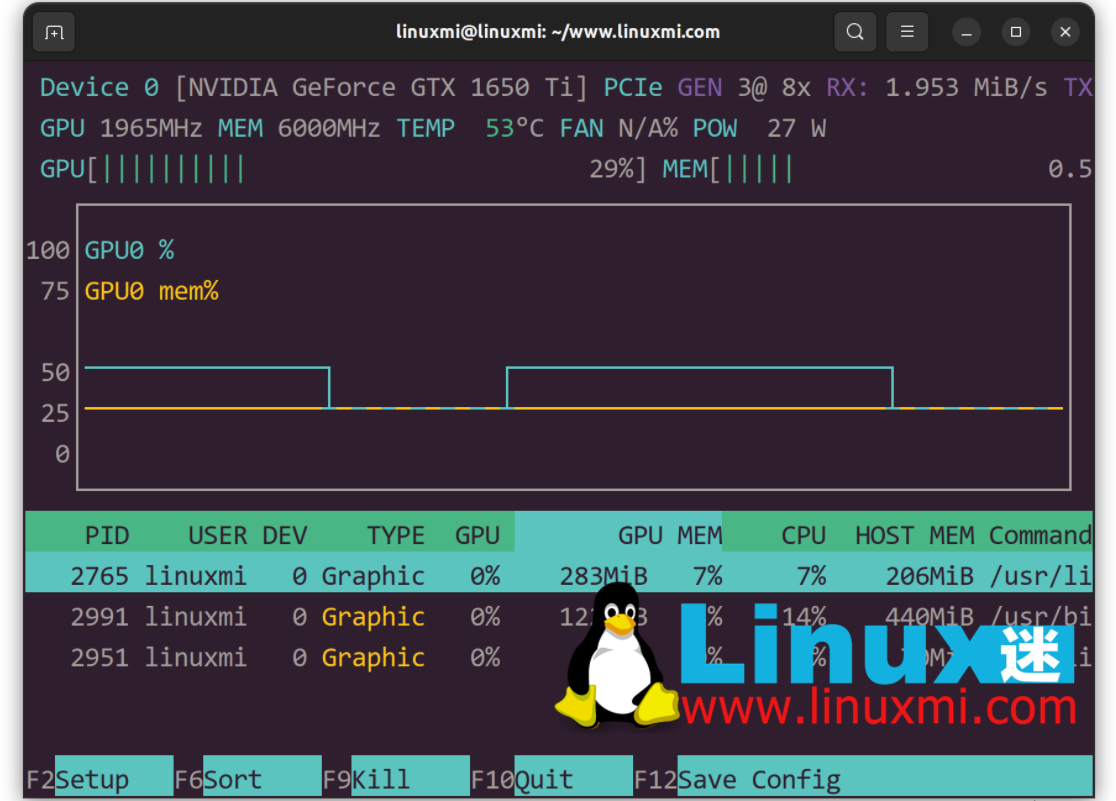
You can also specify the delay between updates in tenths of a second. For example:
linuxmi@linuxmi:~/www.linuxmi.com$nvtop -d 0.25
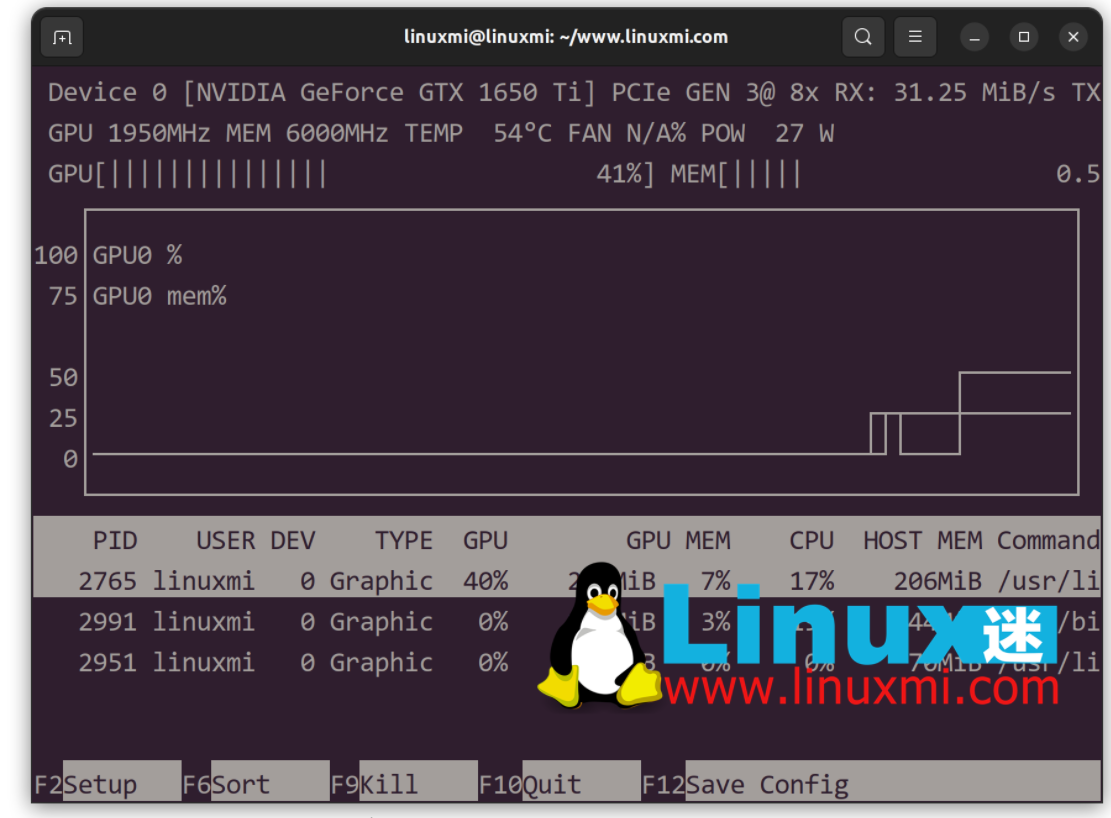
Do you want monochrome mode? Here's how to disable colored output:
linuxmi@linuxmi:~/www.linuxmi.com$ nvtop -C
Here's how to display only one bar, corresponding to the maximum value across all GPUs:
linuxmi@linuxmi:~/www.linuxmi.com$ nvtop -p
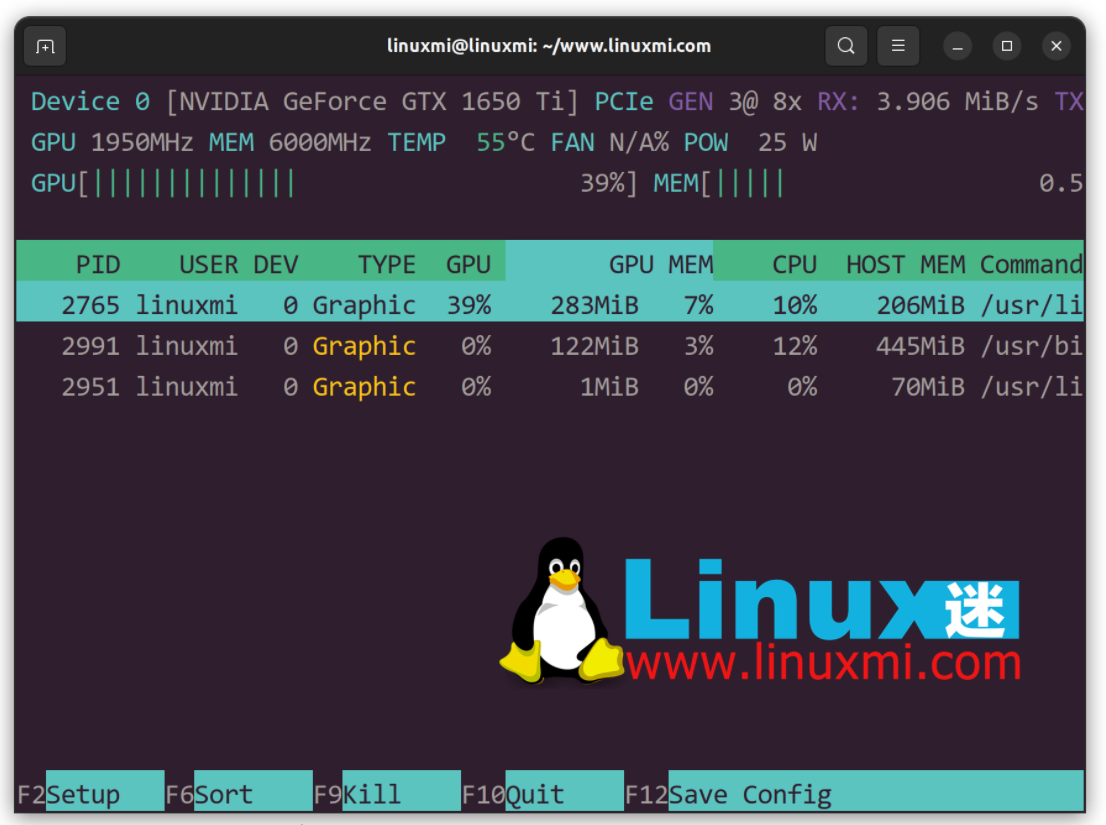
Keyboard shortcuts for the nvtop command
| shortcut key | illustrate |
|---|---|
Up |
Select (highlight) the previous process. |
Down |
Select (highlight) the previous process. |
Left / Right |
Scroll in process line |
|
Sort in ascending order, that is, sort from small to large. |
- |
Sort in descending order, that is, from large to small. |
F2 |
Enter the setting tool to modify the interface options. |
F12 |
Save the current interface options to persistent storage. |
F9 |
"Kill" process: Select the signal to be sent to the highlighted process. |
F6 |
Sort: Select the field to sort. The current sort field will be highlighted in the title bar. |
F10, q, Esc |
Exit the nvtop command. |
Show details
I find nvtop very useful when I need to see what is stress testing my GPU and key information like GPU temperature or fan speed. You can use this tool to quickly kill a process that is using up all GPU resources without having to use the ps command/grep command and then kill the PID. Most modern applications such as Firefox, Chrome, and code written in Python can use dedicated NVIDIA or AMD GPUs. Therefore, it is very useful to have this gadget. Might as well give it a try.
You can read the nvtop manual page in the project repository offline or online. For example, try using the man command or passing the -h option like this:
nvtop -h
The above is the detailed content of nvtop – A great Linux task monitor. For more information, please follow other related articles on the PHP Chinese website!


