
 System Tutorial
LINUX
Linux memory monitoring: understand the system running status in real time
System Tutorial
LINUX
Linux memory monitoring: understand the system running status in real time
Linux memory monitoring: understand the system running status in real time

In today's era of rapid information development, the stability of server systems has attracted more and more attention. As a key part of the server, memory often becomes a bottleneck for system performance issues. In this case, real-time monitoring of memory usage plays a vital role in ensuring system stability and performance. This article will introduce how to monitor memory usage in Linux systems and use some practical commands to understand the running status of the system in real time.
I will be demonstrating on an Ubuntu 18.04 server platform[1], but you should find all commands available in the distribution of your choice. Even better, you don’t need to install anything (as most of these tools are included with Linux systems).
With that said, let’s get to work.
top
I want to start with the most commonly used tools. The top command provides a real-time dynamic view of the running system, it checks the memory usage of each process. This is important because you can easily see multiple examples of the same command consuming different amounts of memory. While you can't see this on a server without a monitor, you've noticed that opening Chrome slows down your system. Run the top command to see that Chrome has multiple processes running (one for each tab – Figure 1).
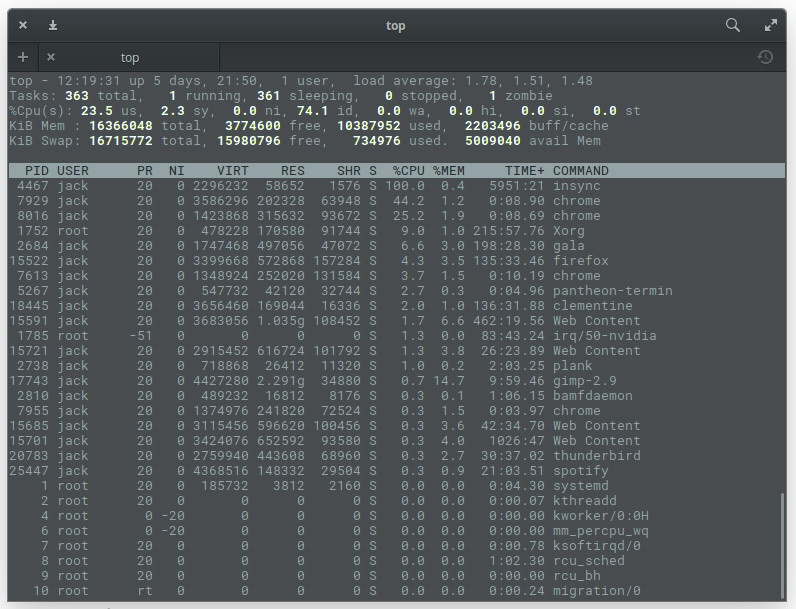
Figure 1: Multiple Chrome processes appear in the top command.
Chrome isn't the only app showing multiple processes. Do you see Firefox in Figure 1? That's Firefox's main process, and the Web Content process is its open tabs. At the top of the output, you'll see system statistics. On my machine (System76 Leopard Extreme[2]) I have a total of 16GB of available RAM, of which just over 10GB is in use. You can then sort through the list to see what percentage of memory each process is using.
top One of the best places to start is discovering the process ID number (PID) of a service that may have gone out of control. With these PIDs, you can troubleshoot (or kill) problematic tasks.
If you want top to display more friendly memory information, use the command top -o %MEM, which will cause top to sort all processes by the memory used by the process (Figure 2).
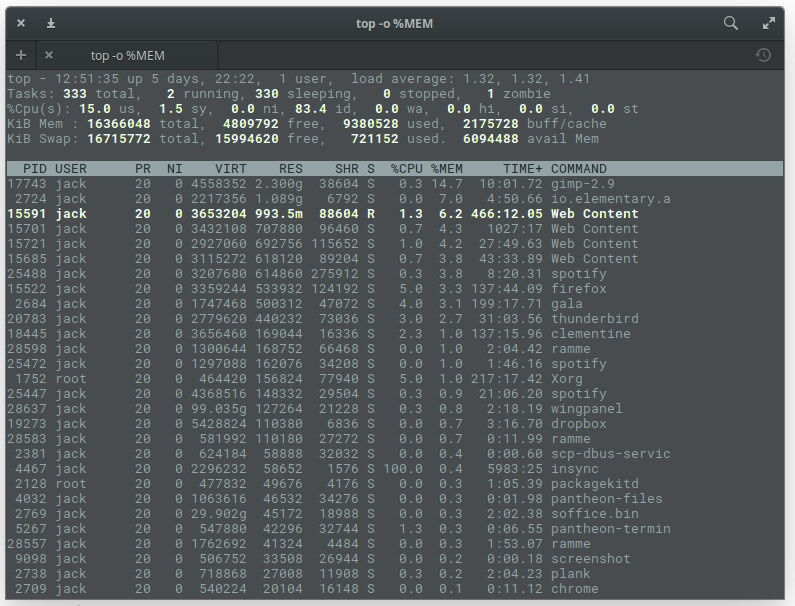
Figure 2: Sorting processes by memory usage in top command
Thetop command also gives you real-time updates on how much swap space is being used.
free
However, sometimes, the top command may not meet your needs. You may just want to look at your system's free and used memory. For this, Linux also has the free command. The free command displays:
- Total available and used physical memory
- Total amount of swap memory in the system
- Buffers and caches used by the kernel
In the terminal window, enter the free command. Its output is not real-time, instead you get an instant snapshot of the current free and used memory (Figure 3).
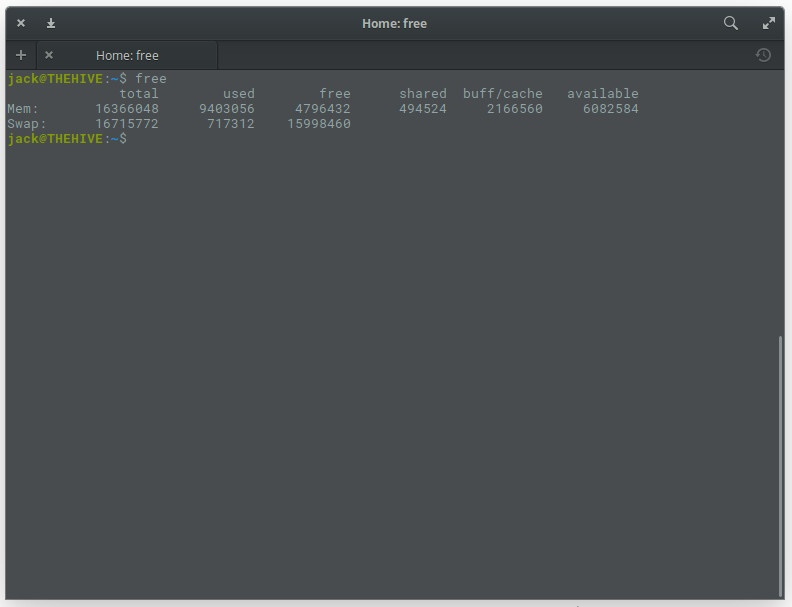
Figure 3: The output of the free command is simple and clear.
Of course, you can make free appear more friendly by adding the -m option, like this: free -m. This will show memory usage in MB (Figure 4).
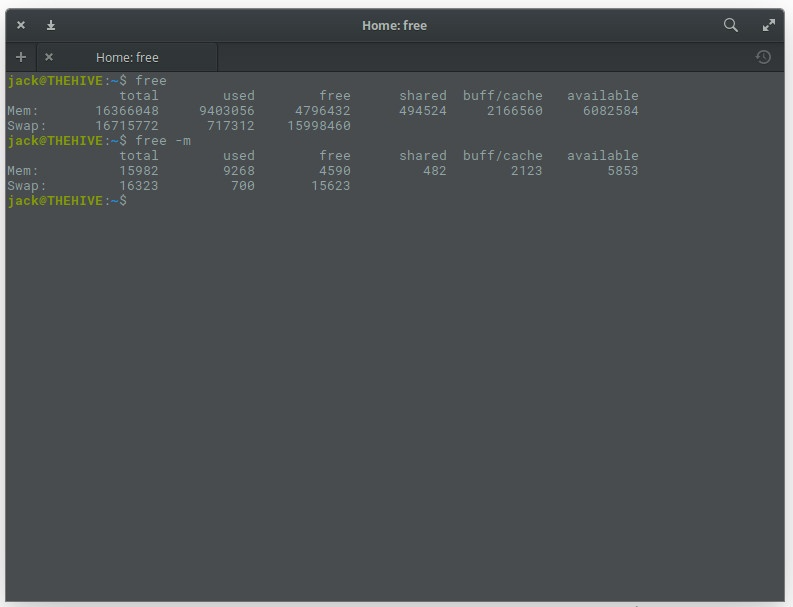
Figure 4: Free command output in a more readable form.
Of course, if your system is very new, you will want to use the -g option (in GB), such as free -g.
If you need to know the total amount of memory, you can add the -t option, such as: free -mt. This will simply calculate the total amount of memory in each column (Figure 5).
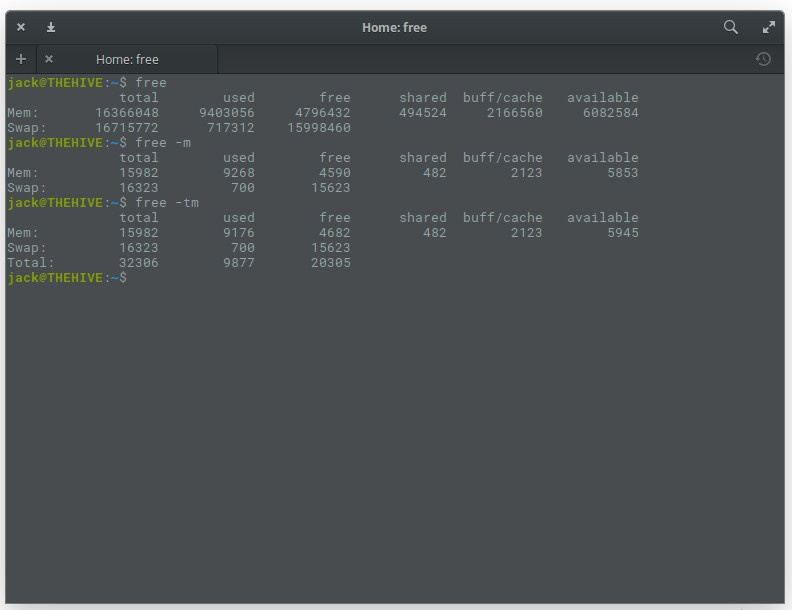
Figure 5: Provides you with free memory columns.
vmstat
Another very convenient tool is vmstat. This particular command is a little trick for reporting virtual memory statistics. The vmstat command will report about:
- process
- Memory
- Pagination
- Blocking IO
- Interrupt
- disk
- CPU
The best way to use vmstat is to use the -s option, such as vmstat -s. This will report the statistics in a single column (which is easier to read than the default report). The vmstat command will provide more information than you need (Figure 6), but more is always better (in this case).
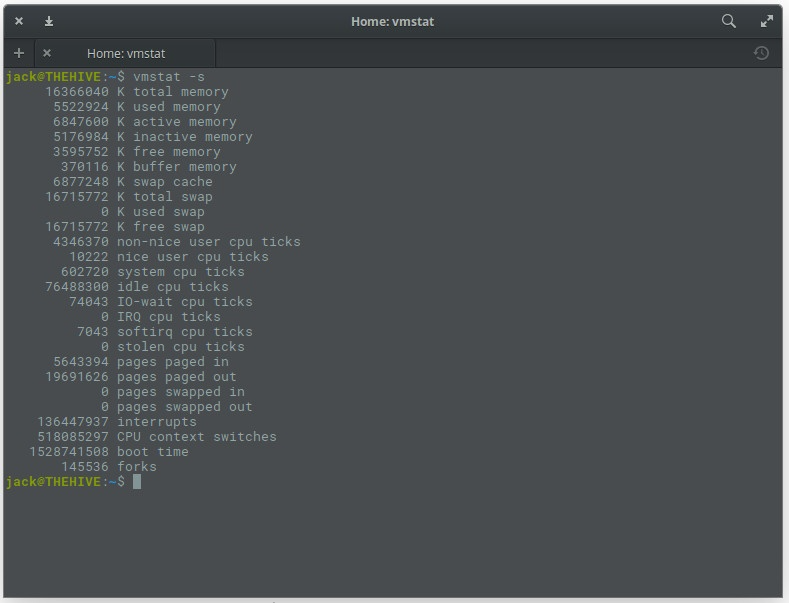
Figure 6: Use the vmstat command to check memory usage.
dmidecode
What if you want to find detailed information about installed system memory? To do this, you can use the dmidecode command. This particular tool is a DMI table decoder, which dumps the contents of your system's DMI tables into a human-readable format. If you're not sure what a DMI table is, it can be used to describe the makeup of a system (and its evolution).
To run the dmidecode command, you need sudo permissions. So enter the command sudo dmidecode -t 17. The output of this command (Figure 7) can be quite long because it displays information for all memory type devices. So if you can't scroll up and down, you may need to send the output of that command to a file, like: sudo dmidecode -t 17> dmi_infoI, or pass it to a less command, like sudo dmidecode | less.
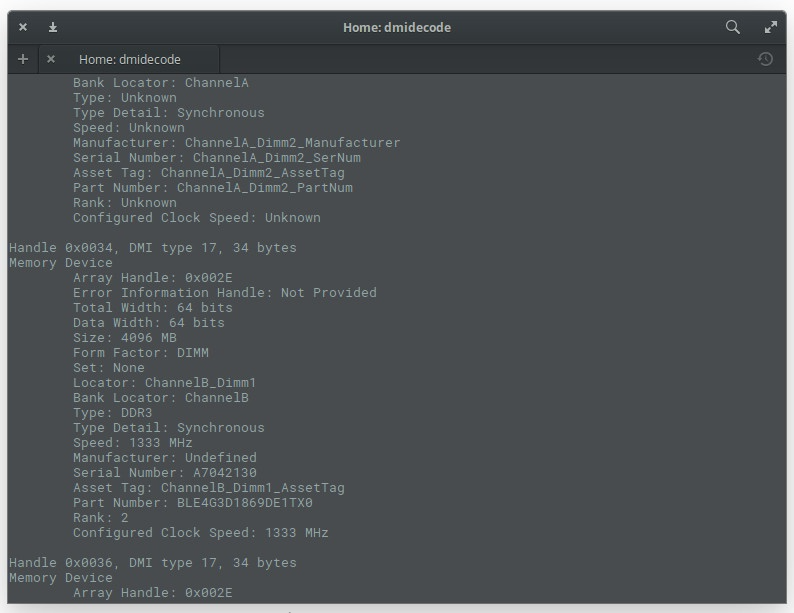
Figure 7: Output of the dmidecode command.
/proc/meminfo
You may be asking yourself: "Where do these commands get this information?" In some cases, they get it from the /proc/meminfo file. Did you guess it? You can read this file directly using the command less /proc/meminfo. By using the less command, you can scroll up and down through long output to find exactly what you need (Figure 8).
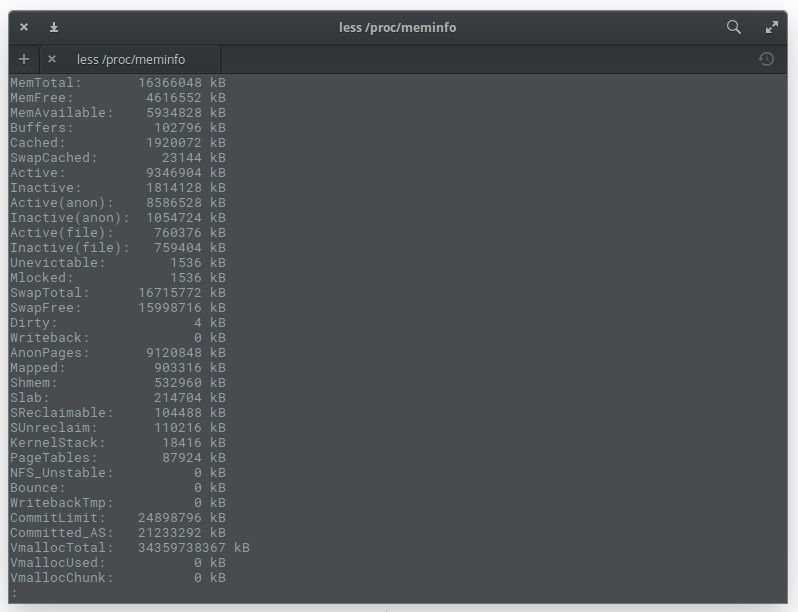
Figure 8: Output of less /proc/meminfo command.
What you should know about /proc/meminfo: This is not a real file. In contrast /proc/meminfo is a virtual file that contains real-time dynamic information about the system. In particular, you need to check the following values:
- All memory (MemTotal)
- Free memory (MemFree)
- Available memory (MemAvailable)
- Buffers
- File cache (Cached)
- SwapCached
- All swap areas (SwapTotal)
- Free swap area (SwapFree)
If you want to use /proc/meminfo, you can connect the egrep command to use it: egrep –color’Mem | Cache | Swap’/proc/meminfo. This will produce an easy-to-read list where entries for things like Mem, Cache, and Swap will be colored (Figure 9).
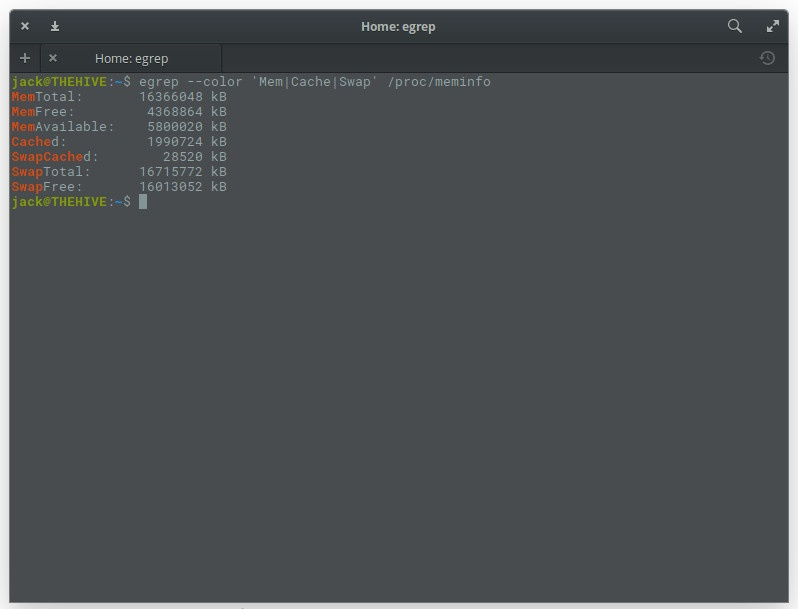
Figure 9: Making /proc/meminfo easier to read.
Whether it is a personal computer or a server system, the use of memory is essential and needs attention during use. This article introduces some practical commands for monitoring and managing memory in Linux systems, which allows us to grasp the running status of the system in real time and effectively avoid system downtime or other failures due to memory problems. Let us deeply understand and master these commands to ensure the safety and performance of the device.
The above is the detailed content of Linux memory monitoring: understand the system running status in real time. For more information, please follow other related articles on the PHP Chinese website!

Hot AI Tools

Undresser.AI Undress
AI-powered app for creating realistic nude photos

AI Clothes Remover
Online AI tool for removing clothes from photos.

Undress AI Tool
Undress images for free

Clothoff.io
AI clothes remover

AI Hentai Generator
Generate AI Hentai for free.

Hot Article
Hot Tools

Notepad++7.3.1
Easy-to-use and free code editor

SublimeText3 Chinese version
Chinese version, very easy to use

Zend Studio 13.0.1
Powerful PHP integrated development environment

Dreamweaver CS6
Visual web development tools

SublimeText3 Mac version
God-level code editing software (SublimeText3)
Hot Topics


 deepseek web version entrance deepseek official website entrance
Feb 19, 2025 pm 04:54 PM
deepseek web version entrance deepseek official website entrance
Feb 19, 2025 pm 04:54 PM
DeepSeek is a powerful intelligent search and analysis tool that provides two access methods: web version and official website. The web version is convenient and efficient, and can be used without installation; the official website provides comprehensive product information, download resources and support services. Whether individuals or corporate users, they can easily obtain and analyze massive data through DeepSeek to improve work efficiency, assist decision-making and promote innovation.
 How to install deepseek
Feb 19, 2025 pm 05:48 PM
How to install deepseek
Feb 19, 2025 pm 05:48 PM
There are many ways to install DeepSeek, including: compile from source (for experienced developers) using precompiled packages (for Windows users) using Docker containers (for most convenient, no need to worry about compatibility) No matter which method you choose, Please read the official documents carefully and prepare them fully to avoid unnecessary trouble.
 Ouyi okx installation package is directly included
Feb 21, 2025 pm 08:00 PM
Ouyi okx installation package is directly included
Feb 21, 2025 pm 08:00 PM
Ouyi OKX, the world's leading digital asset exchange, has now launched an official installation package to provide a safe and convenient trading experience. The OKX installation package of Ouyi does not need to be accessed through a browser. It can directly install independent applications on the device, creating a stable and efficient trading platform for users. The installation process is simple and easy to understand. Users only need to download the latest version of the installation package and follow the prompts to complete the installation step by step.
 BITGet official website installation (2025 beginner's guide)
Feb 21, 2025 pm 08:42 PM
BITGet official website installation (2025 beginner's guide)
Feb 21, 2025 pm 08:42 PM
BITGet is a cryptocurrency exchange that provides a variety of trading services including spot trading, contract trading and derivatives. Founded in 2018, the exchange is headquartered in Singapore and is committed to providing users with a safe and reliable trading platform. BITGet offers a variety of trading pairs, including BTC/USDT, ETH/USDT and XRP/USDT. Additionally, the exchange has a reputation for security and liquidity and offers a variety of features such as premium order types, leveraged trading and 24/7 customer support.
 Get the gate.io installation package for free
Feb 21, 2025 pm 08:21 PM
Get the gate.io installation package for free
Feb 21, 2025 pm 08:21 PM
Gate.io is a popular cryptocurrency exchange that users can use by downloading its installation package and installing it on their devices. The steps to obtain the installation package are as follows: Visit the official website of Gate.io, click "Download", select the corresponding operating system (Windows, Mac or Linux), and download the installation package to your computer. It is recommended to temporarily disable antivirus software or firewall during installation to ensure smooth installation. After completion, the user needs to create a Gate.io account to start using it.
 Ouyi Exchange Download Official Portal
Feb 21, 2025 pm 07:51 PM
Ouyi Exchange Download Official Portal
Feb 21, 2025 pm 07:51 PM
Ouyi, also known as OKX, is a world-leading cryptocurrency trading platform. The article provides a download portal for Ouyi's official installation package, which facilitates users to install Ouyi client on different devices. This installation package supports Windows, Mac, Android and iOS systems. Users can choose the corresponding version to download according to their device type. After the installation is completed, users can register or log in to the Ouyi account, start trading cryptocurrencies and enjoy other services provided by the platform.
 How to automatically set permissions of unixsocket after system restart?
Mar 31, 2025 pm 11:54 PM
How to automatically set permissions of unixsocket after system restart?
Mar 31, 2025 pm 11:54 PM
How to automatically set the permissions of unixsocket after the system restarts. Every time the system restarts, we need to execute the following command to modify the permissions of unixsocket: sudo...
 How to solve the permissions problem encountered when viewing Python version in Linux terminal?
Apr 01, 2025 pm 05:09 PM
How to solve the permissions problem encountered when viewing Python version in Linux terminal?
Apr 01, 2025 pm 05:09 PM
Solution to permission issues when viewing Python version in Linux terminal When you try to view Python version in Linux terminal, enter python...
