

How to use CoreFreq to monitor the CPU performance of your Linux system

CoreFreq is a CPU monitoring software specially designed for 64-bit processors. It supports Intel Atom, Core2, Nehalem, SandyBridge and above architectures, as well as AMD 0F to 19h (Zen3) families. CoreFreq can provide a high-precision framework to obtain various CPU data, including:
- Core Frequencies and Ratios
- SpeedStep (EIST), Turbo Boost, Hyper-Threading (HTT) and Base Clock
- Performance counters, including timestamp counter (TSC), unstopped core cycle (UCC), unstopped reference cycle (URC)
- Instructions per cycle or per second, IPS, IPC or CPI
- CPU C status, C0 C1 C3 C6 C7, etc.
- Topology diagram, including cache for boot and application CPU
- Processor feature, brand, and architecture string
In this article, we will introduce how to install and use CoreFreq in Linux systems, as well as some commonly used options and parameters. We'll be using Ubuntu 20.04 as the example system, but the content applies to other Linux distributions as well.
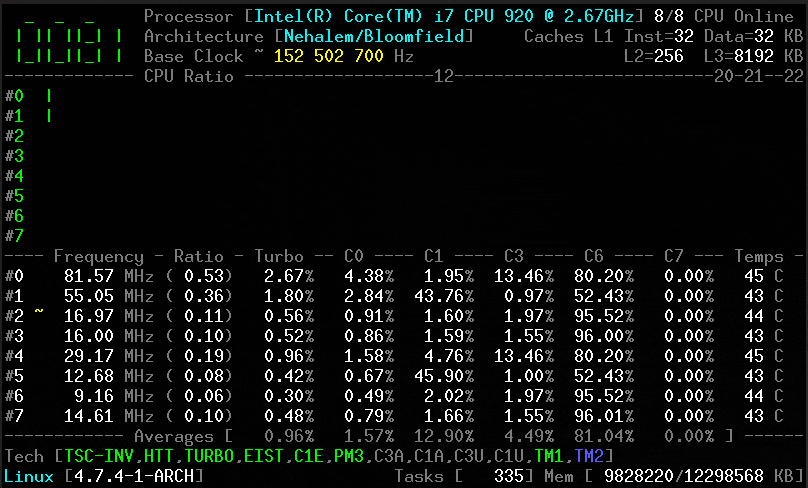
CoreFreq CPU Monitoring
It provides the basis for recapturing CPU data with high accuracy:
- Core frequencies and ratios; SpeedStep (EIST), Turbo Boost, Hyper-Threading (HTT), and base clock.
- Performance counters combine timestamp counters (TSC), non-halting core cycles (UCC), and non-halting reference cycles (URC).
- Instructions per cycle or second: IPS, IPC, or CPI.
- CPU C states: C0 C1 C3 C6 C7 – C1E – Auto/non-degradation of C1, C3.
- DTS temperature and thermal monitoring TM1 and TM2 status with Tjunction Max.
- Includes cache and application CPU topology maps for bootstrapping.
- Processor characteristics, brand, architecture strings.
Note: This tool is more suitable for expert Linux users and experienced system administrators, but novice users can learn how to use it step by step.
HowCoreFreq works
It is implemented by calling a Linux kernel module, which uses:
- Assembly code is kept as close as possible to the performance counter readings.
- Slab data memory plus high-resolution timers affected on a per-CPU basis.
- Supports CPU suspend/resume and CPU hotplug.
- Use shared memory to protect the kernel from damage from user space programs.
- Use atomically synchronized threads to eliminate mutual exclusion and deadlocks.
How to install CoreFreq in Linux
To install CoreFreq, you first need to install dependencies (development tools) to compile and build the program from source.
$ sudo yum group install 'Development Tools'           [On CentOS/RHEL]
$ sudo dnf  group install 'Development Tools'          [On Fedora 22+ Versions]
# sudo apt-get install dkms git libpthread-stubs0-dev  [On Debian/Ubuntu]
Next, clone the CoreFreq source code on Github, enter the download folder and compile the build program:
    $ git clone https://github.com/cyring/CoreFreq.git
    $ cd CoreFreq
    $ make
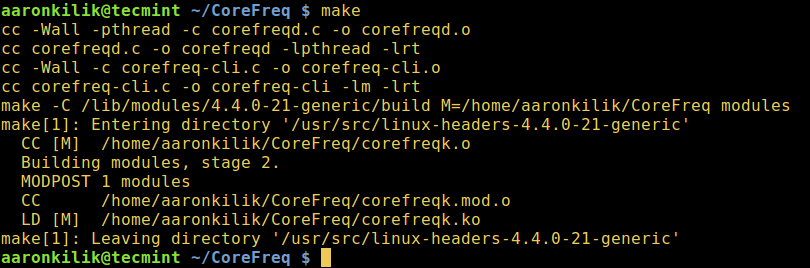
Building the CoreFreq program
Note: Arch Linux users can install corefreq-git from the AUR.
Now run the following command to load the Linux kernel module from the local directory and then run the daemon:
    $ sudo insmod corefreqk.ko
    $ sudo ./corefreqd
Then use a normal user to start the client.
$ ./corefreq-cli
CoreFreq Linux CPU Monitoring
In the above interface, you can use these shortcut keys:
- Use F2 to display the usage menu shown at the top of the screen.
- Use the right and left arrows to move menu tabs.
- Use the up and down arrows to select a menu item and click Enter.
- Use F4 to close the program.
- Use h to open the quick reference.
To view all usage options, enter the following command:
$ ./corefreq-cli -h
CoreFreq Options:
    CoreFreq.  Copyright (C) 2015-2017 CYRIL INGENIERIE
    usage:  corefreq-cli [-option ]
    -t  Show Top (default)
    -d  Show Dashboard
    arguments:
    -c  Monitor Counters
    -i  Monitor Instructions
    -s  Print System Information
    -M  Print Memory Controller
    -m  Print Topology
    -u  Print CPUID
    -k  Print Kernel
    -h  Print out this message
    Exit status:
    0   if OK,
    1   if problems,
    >1  if serious trouble.
    Report bugs to labs[at]cyring.fr
To print kernel information, run:
$ ./corefreq-cli -k
Print CPU details:
$ ./corefreq-cli -u
You can also monitor CPU instructions in real time:
$ ./corefreq-cli -i
Enable counter tracking as follows:
$ ./corefreq-cli -c
在本文中,我们学习了如何在Linux系统中安装和使用CoreFreq,以及一些常用的选项和参数。我们了解了如何查看和分析CPU的性能和状态,以及如何使用CoreFreq提供的图形界面和命令行界面。我们还学习了如何使用CoreFreq进行一些高级操作,比如调整CPU频率、比率和电压,以及测试CPU稳定性和散热性能。
CoreFreq是一个强大而专业的CPU监控软件,它可以让你更好地了解和优化你的CPU性能。通过使用CoreFreq,你可以提高你的系统效率和用户体验。我们建议你在使用Linux系统时,经常使用CoreFreq来监控你的CPU性能。
The above is the detailed content of How to use CoreFreq to monitor the CPU performance of your Linux system. For more information, please follow other related articles on the PHP Chinese website!

Hot AI Tools

Undresser.AI Undress
AI-powered app for creating realistic nude photos

AI Clothes Remover
Online AI tool for removing clothes from photos.

Undress AI Tool
Undress images for free

Clothoff.io
AI clothes remover

Video Face Swap
Swap faces in any video effortlessly with our completely free AI face swap tool!

Hot Article
Hot Tools

Notepad++7.3.1
Easy-to-use and free code editor

SublimeText3 Chinese version
Chinese version, very easy to use

Zend Studio 13.0.1
Powerful PHP integrated development environment

Dreamweaver CS6
Visual web development tools

SublimeText3 Mac version
God-level code editing software (SublimeText3)
Hot Topics


 What computer configuration is required for vscode
Apr 15, 2025 pm 09:48 PM
What computer configuration is required for vscode
Apr 15, 2025 pm 09:48 PM
VS Code system requirements: Operating system: Windows 10 and above, macOS 10.12 and above, Linux distribution processor: minimum 1.6 GHz, recommended 2.0 GHz and above memory: minimum 512 MB, recommended 4 GB and above storage space: minimum 250 MB, recommended 1 GB and above other requirements: stable network connection, Xorg/Wayland (Linux)
 vscode cannot install extension
Apr 15, 2025 pm 07:18 PM
vscode cannot install extension
Apr 15, 2025 pm 07:18 PM
The reasons for the installation of VS Code extensions may be: network instability, insufficient permissions, system compatibility issues, VS Code version is too old, antivirus software or firewall interference. By checking network connections, permissions, log files, updating VS Code, disabling security software, and restarting VS Code or computers, you can gradually troubleshoot and resolve issues.
 How to run java code in notepad
Apr 16, 2025 pm 07:39 PM
How to run java code in notepad
Apr 16, 2025 pm 07:39 PM
Although Notepad cannot run Java code directly, it can be achieved by using other tools: using the command line compiler (javac) to generate a bytecode file (filename.class). Use the Java interpreter (java) to interpret bytecode, execute the code, and output the result.
 What is vscode What is vscode for?
Apr 15, 2025 pm 06:45 PM
What is vscode What is vscode for?
Apr 15, 2025 pm 06:45 PM
VS Code is the full name Visual Studio Code, which is a free and open source cross-platform code editor and development environment developed by Microsoft. It supports a wide range of programming languages and provides syntax highlighting, code automatic completion, code snippets and smart prompts to improve development efficiency. Through a rich extension ecosystem, users can add extensions to specific needs and languages, such as debuggers, code formatting tools, and Git integrations. VS Code also includes an intuitive debugger that helps quickly find and resolve bugs in your code.
 Can vscode be used for mac
Apr 15, 2025 pm 07:36 PM
Can vscode be used for mac
Apr 15, 2025 pm 07:36 PM
VS Code is available on Mac. It has powerful extensions, Git integration, terminal and debugger, and also offers a wealth of setup options. However, for particularly large projects or highly professional development, VS Code may have performance or functional limitations.
 How to use VSCode
Apr 15, 2025 pm 11:21 PM
How to use VSCode
Apr 15, 2025 pm 11:21 PM
Visual Studio Code (VSCode) is a cross-platform, open source and free code editor developed by Microsoft. It is known for its lightweight, scalability and support for a wide range of programming languages. To install VSCode, please visit the official website to download and run the installer. When using VSCode, you can create new projects, edit code, debug code, navigate projects, expand VSCode, and manage settings. VSCode is available for Windows, macOS, and Linux, supports multiple programming languages and provides various extensions through Marketplace. Its advantages include lightweight, scalability, extensive language support, rich features and version
 What is the main purpose of Linux?
Apr 16, 2025 am 12:19 AM
What is the main purpose of Linux?
Apr 16, 2025 am 12:19 AM
The main uses of Linux include: 1. Server operating system, 2. Embedded system, 3. Desktop operating system, 4. Development and testing environment. Linux excels in these areas, providing stability, security and efficient development tools.
 How to check the warehouse address of git
Apr 17, 2025 pm 01:54 PM
How to check the warehouse address of git
Apr 17, 2025 pm 01:54 PM
To view the Git repository address, perform the following steps: 1. Open the command line and navigate to the repository directory; 2. Run the "git remote -v" command; 3. View the repository name in the output and its corresponding address.
