My favorite Linux top command options
When I check a Linux system (or even troubleshoot a computer running another operating system), I often use the top command to check the system's RAM and CPU usage. It provides me with information to assess the overall health of my computer. I learned about the top command early in my Linux journey and relied on it to give me a quick overview of what was going on on a server or other Linux system, including a Raspberry Pi. But there's more to the top command than meets the eye. According to its man page, the top program provides a dynamic, real-time view of a running system. It displays system summary information and a list of processes or threads currently managed by the Linux kernel.
However, there is more to the top command than meets the eye. The specific functionality of your top command may vary depending on the version you are running (procps-ng, Busybox, BSD), so see the man page for details.
To start top, enter in the terminal:
linuxmi@linuxmi:~/www.linuxmi.com$ top
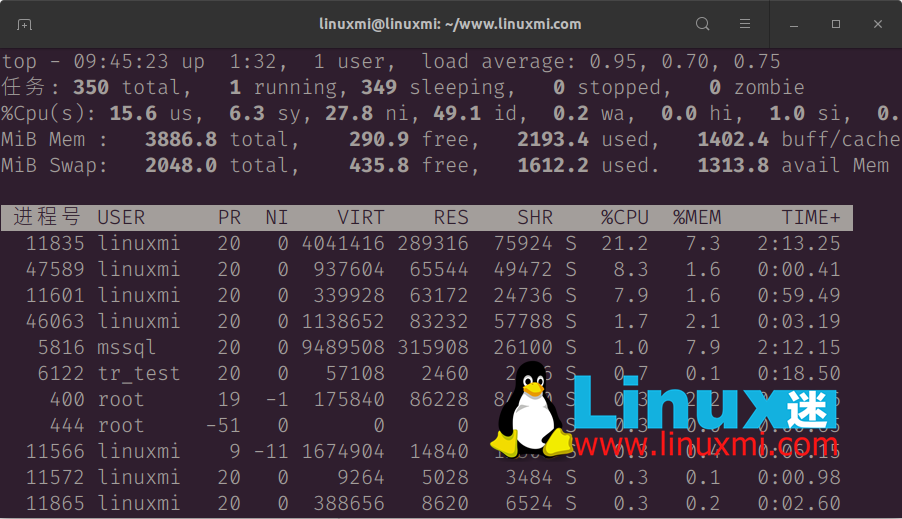
Running processes are displayed below the table title on the top screen, and system statistics are displayed above it.
top - 09:46:05 up  1:33,  1 user,  load average: 0.76, 0.67, 0.74
任务: 350 total,   1 running, 349 sleeping,   0 stopped,   0 zombie
%Cpu(s):  1.0 us,  0.7 sy,  0.0 ni, 97.8 id,  0.0 wa,  0.0 hi,  0.5 si,  0.
MiB Mem :   3886.8 total,    307.9 free,   2175.1 used,   1403.8 buff/cache
MiB Swap:   2048.0 total,    435.8 free,   1612.2 used.   1332.7 avail Mem

 进程号 USER      PR  NI    VIRT    RES    SHR    %CPU  %MEM     TIME+
   5816 mssql     20   0 9489420 315860  26100 S   2.3   7.9   2:12.97
     99 root       0 -20       0      0      0 I   0.7   0.0   0:09.20
   1141 root      20   0  242936   6504   5452 S   0.7   0.2   0:37.47
  11835 linuxmi   20   0 4041480 290588  75920 S   0.7   7.3   2:16.77
   1924 root      20   0   66412   4732   4156 S   0.3   0.1   0:14.17
   2815 vcache    20   0  278864  87112  85116 S   0.3   2.2   0:03.56
   3371 linuxmi+  20   0  190672   5148   3132 S   0.3   0.1   0:04.49
   3598 linuxmi+  20   0   57108   2404   2032 S   0.3   0.1   0:16.62
   5864 tr_test   20   0  190672   5780   3080 S   0.3   0.1   0:04.62
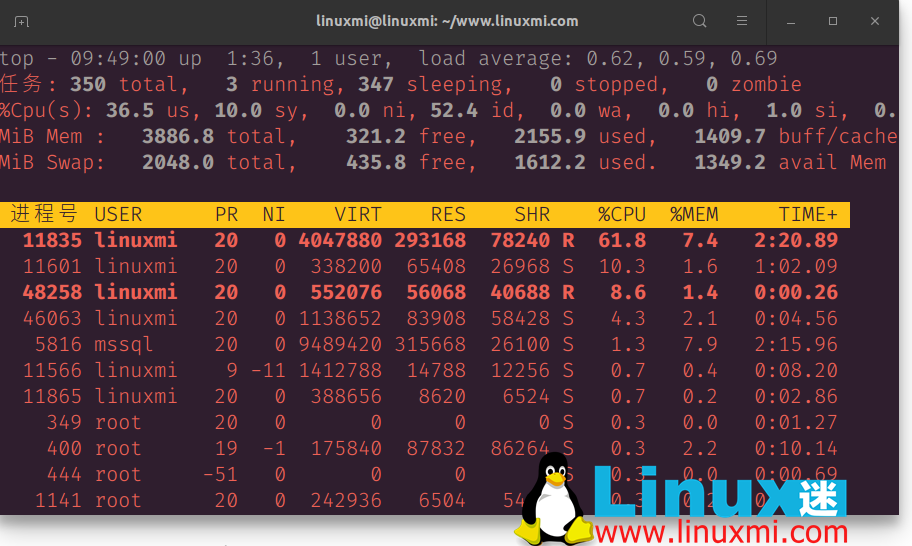
Press the Z key to change the color of the output. I find this makes the output easier on the eye.
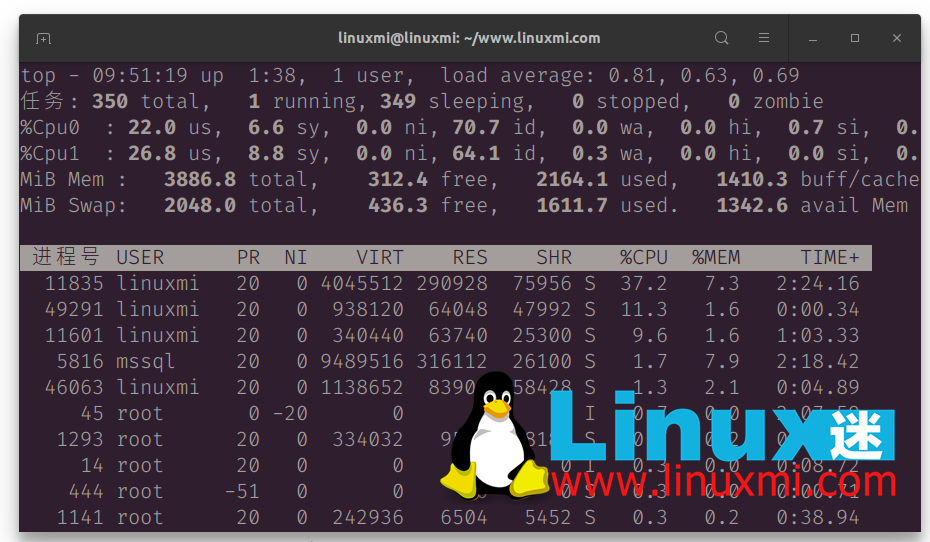
Press the 1 key to view a graphical representation of each CPU core on the system. Press 1 repeatedly to evaluate the kernel statistics of the CPU core.
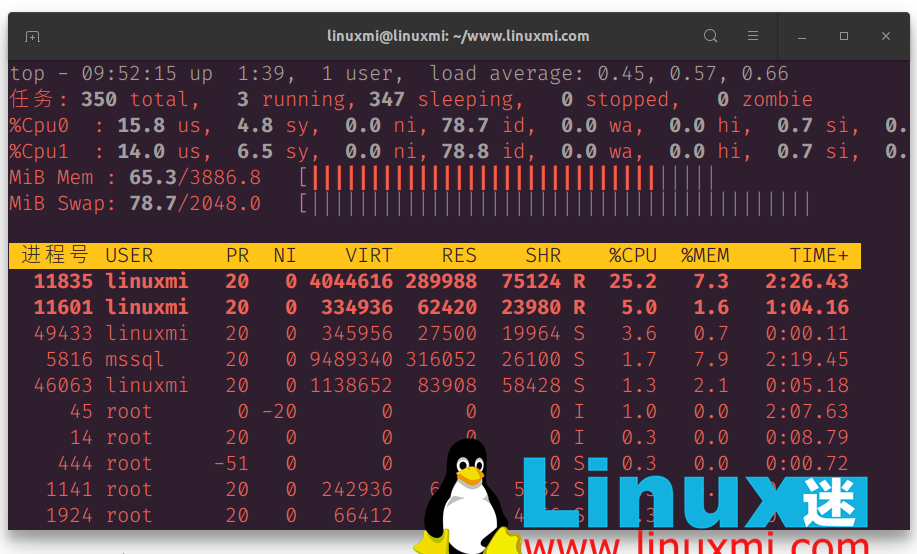
You can graphically display memory usage by calling the top command and then pressing the m key.
Useful top options
If you are only looking for processes started by a specific user, you can use the following -u option to get that information:
linuxmi@linuxmi:~/www.linuxmi.com$ top -u 'root'
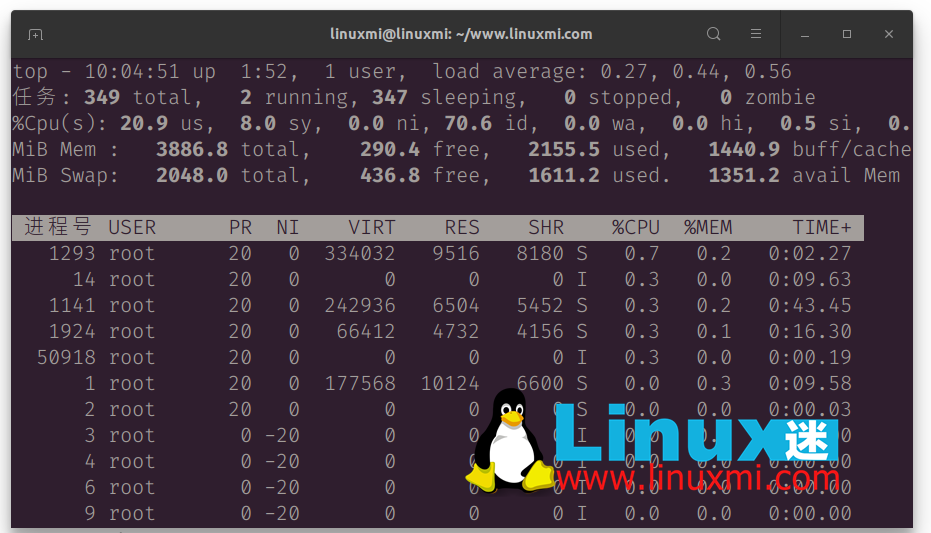
To obtain a list of idle processes on the system, use the following -i option:
linuxmi@linuxmi:~/www.linuxmi.com$ top -i
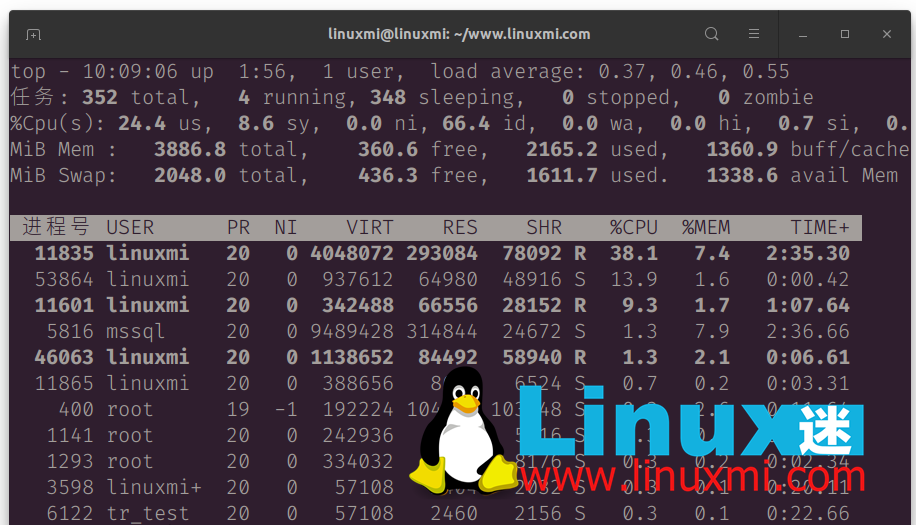
You can set the update interval to any value in seconds. The default value is 3 seconds. Change it to 5 like this:
linuxmi@linuxmi:~/www.linuxmi.com$ top -d 5
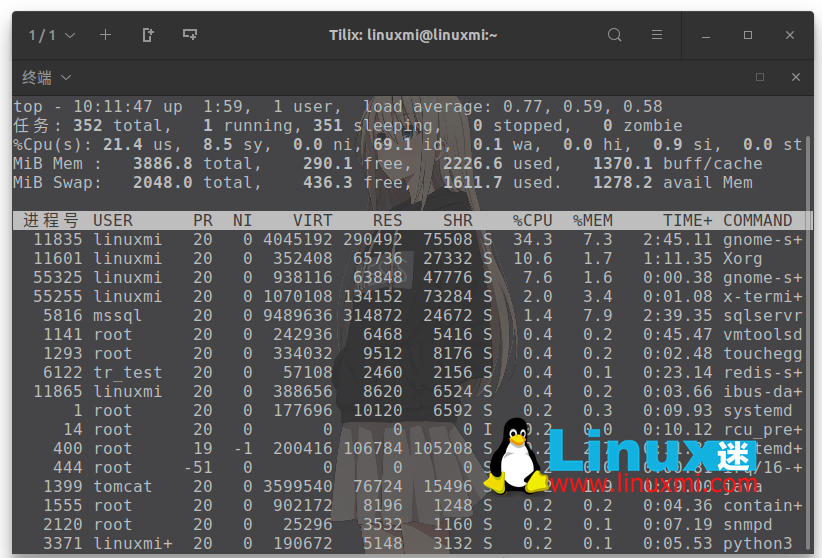
You can also run top on a timer. For example, the following command sets the number of iterations to two and then exits:
linuxmi@linuxmi:~/www.linuxmi.com$ top -n 2
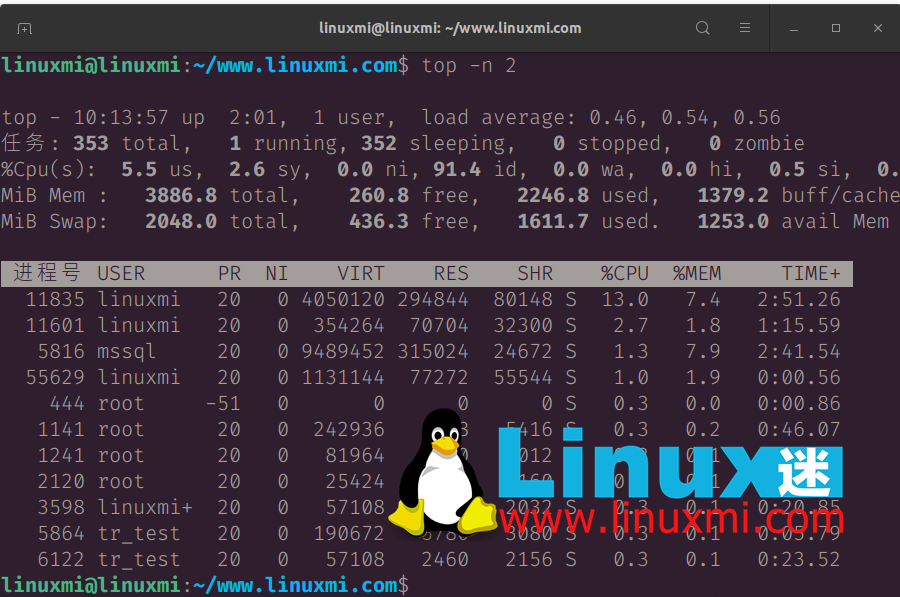
Use top to locate a process
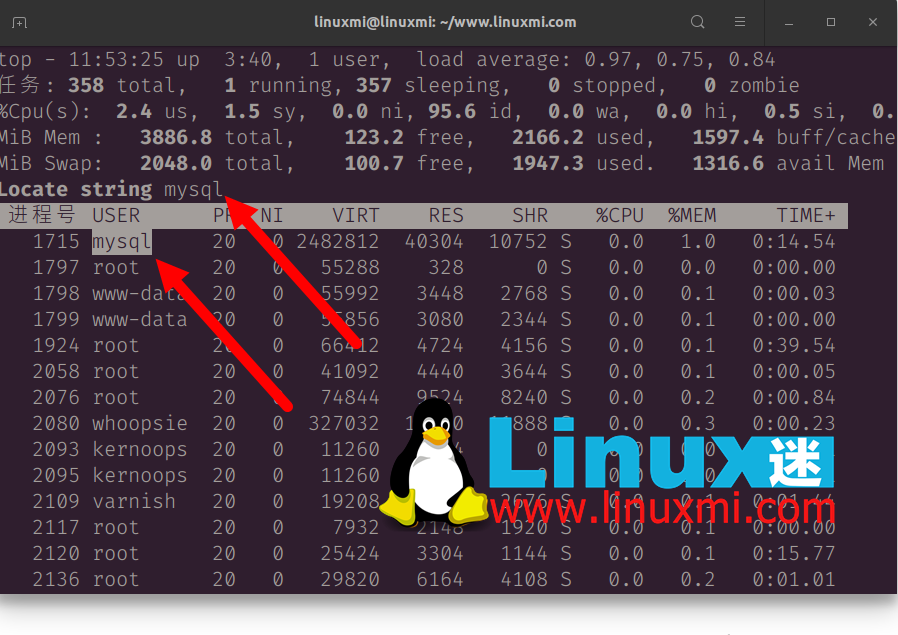
Press Shift L to find processes by name. This creates a hint above the bold table title row. Enter the name of the process you want to find and press Enter or Return to see instances of that process highlighted in the newly sorted list of processes.
Use top to stop the process
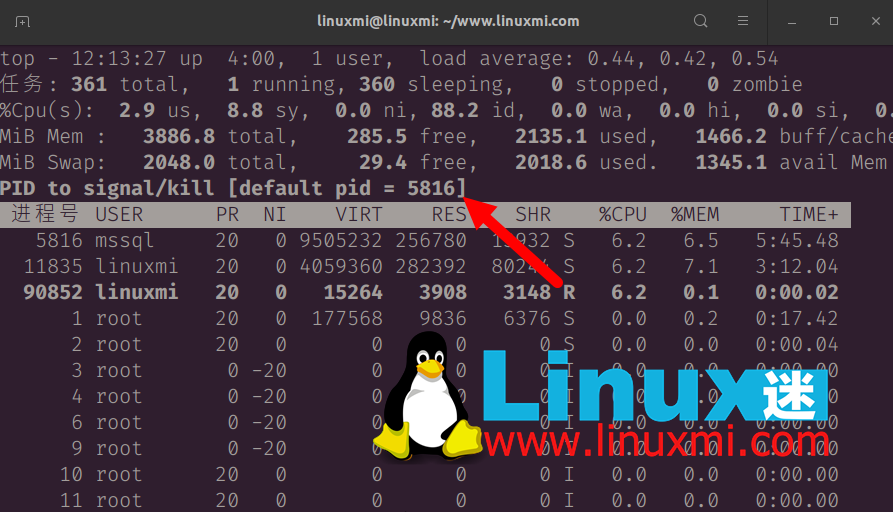
You can also use top to stop or "kill" a running process. First, find the process you want to stop using Shift L or pgrep. Next, press K and enter the ID of the process you want to stop. The default value is whatever is at the top of the list, so make sure you enter the PID you want to stop before pressing Enter, otherwise you might stop a process you didn't intend to stop.
top iteration
This command has many iterations top, including htop, atop, btop and ttop. There are also specialized top commands, such as the Linux power saving tool powertop and the network traffic monitoring tool ntop.
The above is the detailed content of My favorite Linux top command options. For more information, please follow other related articles on the PHP Chinese website!

Hot AI Tools

Undresser.AI Undress
AI-powered app for creating realistic nude photos

AI Clothes Remover
Online AI tool for removing clothes from photos.

Undress AI Tool
Undress images for free

Clothoff.io
AI clothes remover

Video Face Swap
Swap faces in any video effortlessly with our completely free AI face swap tool!

Hot Article

Hot Tools

Notepad++7.3.1
Easy-to-use and free code editor

SublimeText3 Chinese version
Chinese version, very easy to use

Zend Studio 13.0.1
Powerful PHP integrated development environment

Dreamweaver CS6
Visual web development tools

SublimeText3 Mac version
God-level code editing software (SublimeText3)

Hot Topics
 1386
1386
 52
52
 How to use docker desktop
Apr 15, 2025 am 11:45 AM
How to use Docker Desktop? Docker Desktop is a tool for running Docker containers on local machines. The steps to use include: 1. Install Docker Desktop; 2. Start Docker Desktop; 3. Create Docker image (using Dockerfile); 4. Build Docker image (using docker build); 5. Run Docker container (using docker run).
 Difference between centos and ubuntu
Apr 14, 2025 pm 09:09 PM
The key differences between CentOS and Ubuntu are: origin (CentOS originates from Red Hat, for enterprises; Ubuntu originates from Debian, for individuals), package management (CentOS uses yum, focusing on stability; Ubuntu uses apt, for high update frequency), support cycle (CentOS provides 10 years of support, Ubuntu provides 5 years of LTS support), community support (CentOS focuses on stability, Ubuntu provides a wide range of tutorials and documents), uses (CentOS is biased towards servers, Ubuntu is suitable for servers and desktops), other differences include installation simplicity (CentOS is thin)
 What to do if the docker image fails
Apr 15, 2025 am 11:21 AM
Troubleshooting steps for failed Docker image build: Check Dockerfile syntax and dependency version. Check if the build context contains the required source code and dependencies. View the build log for error details. Use the --target option to build a hierarchical phase to identify failure points. Make sure to use the latest version of Docker engine. Build the image with --t [image-name]:debug mode to debug the problem. Check disk space and make sure it is sufficient. Disable SELinux to prevent interference with the build process. Ask community platforms for help, provide Dockerfiles and build log descriptions for more specific suggestions.
 How to view the docker process
Apr 15, 2025 am 11:48 AM
Docker process viewing method: 1. Docker CLI command: docker ps; 2. Systemd CLI command: systemctl status docker; 3. Docker Compose CLI command: docker-compose ps; 4. Process Explorer (Windows); 5. /proc directory (Linux).
 What computer configuration is required for vscode
Apr 15, 2025 pm 09:48 PM
VS Code system requirements: Operating system: Windows 10 and above, macOS 10.12 and above, Linux distribution processor: minimum 1.6 GHz, recommended 2.0 GHz and above memory: minimum 512 MB, recommended 4 GB and above storage space: minimum 250 MB, recommended 1 GB and above other requirements: stable network connection, Xorg/Wayland (Linux)
 Detailed explanation of docker principle
Apr 14, 2025 pm 11:57 PM
Docker uses Linux kernel features to provide an efficient and isolated application running environment. Its working principle is as follows: 1. The mirror is used as a read-only template, which contains everything you need to run the application; 2. The Union File System (UnionFS) stacks multiple file systems, only storing the differences, saving space and speeding up; 3. The daemon manages the mirrors and containers, and the client uses them for interaction; 4. Namespaces and cgroups implement container isolation and resource limitations; 5. Multiple network modes support container interconnection. Only by understanding these core concepts can you better utilize Docker.
 What is vscode What is vscode for?
Apr 15, 2025 pm 06:45 PM
VS Code is the full name Visual Studio Code, which is a free and open source cross-platform code editor and development environment developed by Microsoft. It supports a wide range of programming languages and provides syntax highlighting, code automatic completion, code snippets and smart prompts to improve development efficiency. Through a rich extension ecosystem, users can add extensions to specific needs and languages, such as debuggers, code formatting tools, and Git integrations. VS Code also includes an intuitive debugger that helps quickly find and resolve bugs in your code.
 How to switch Chinese mode with vscode
Apr 15, 2025 pm 11:39 PM
VS Code To switch Chinese mode: Open the settings interface (Windows/Linux: Ctrl, macOS: Cmd,) Search for "Editor: Language" settings Select "Chinese" in the drop-down menu Save settings and restart VS Code


