Summarize the various methods of checking memory usage under Linux
Memory is a key resource in a computer system, and it is even more crucial for the Linux operating system. But have you ever encountered out-of-memory problems or felt that your system's memory usage was inefficient? This article will give you an in-depth understanding of Linux memory-related concepts and principles, thereby helping you better manage and optimize system memory.
1./proc/meminfo
The easiest way to view RAM usage is through /proc/meminfo. This dynamically updated virtual file is actually a combination display of many other memory-related tools (such as: free / ps / top), etc. /proc/meminfo lists all the memory usage you want to know about. The memory usage information of the process can also be viewed through /proc//statm and /proc//status.
$ cat /proc/meminfo
MemTotal:        8010436 kB
MemFree:         7514008 kB
MemAvailable:    7567204 kB
Buffers:             872 kB
Cached:           282844 kB
SwapCached:            0 kB
Active:           213156 kB
Inactive:         111632 kB
Active(anon):      41264 kB
Inactive(anon):    32888 kB
Active(file):     171892 kB
Inactive(file):    78744 kB
Unevictable:           0 kB
Mlocked:               0 kB
SwapTotal:             0 kB
SwapFree:              0 kB
Dirty:                32 kB
Writeback:             0 kB
AnonPages:         41088 kB
Mapped:            35936 kB
Shmem:             33080 kB
Slab:              66888 kB
SReclaimable:      48120 kB
SUnreclaim:        18768 kB
KernelStack:        1872 kB
PageTables:         2788 kB
NFS_Unstable:          0 kB
Bounce:                0 kB
WritebackTmp:          0 kB
CommitLimit:     4005216 kB
Committed_AS:     272452 kB
VmallocTotal:   34359738367 kB
VmallocUsed:       22136 kB
VmallocChunk:   34359707388 kB
HardwareCorrupted:     0 kB
AnonHugePages:      4096 kB
HugePages_Total:       0
HugePages_Free:        0
HugePages_Rsvd:        0
HugePages_Surp:        0
Hugepagesize:       2048 kB
DirectMap4k:       79740 kB
DirectMap2M:     3065856 kB
DirectMap1G:     7340032 kB
2.atop
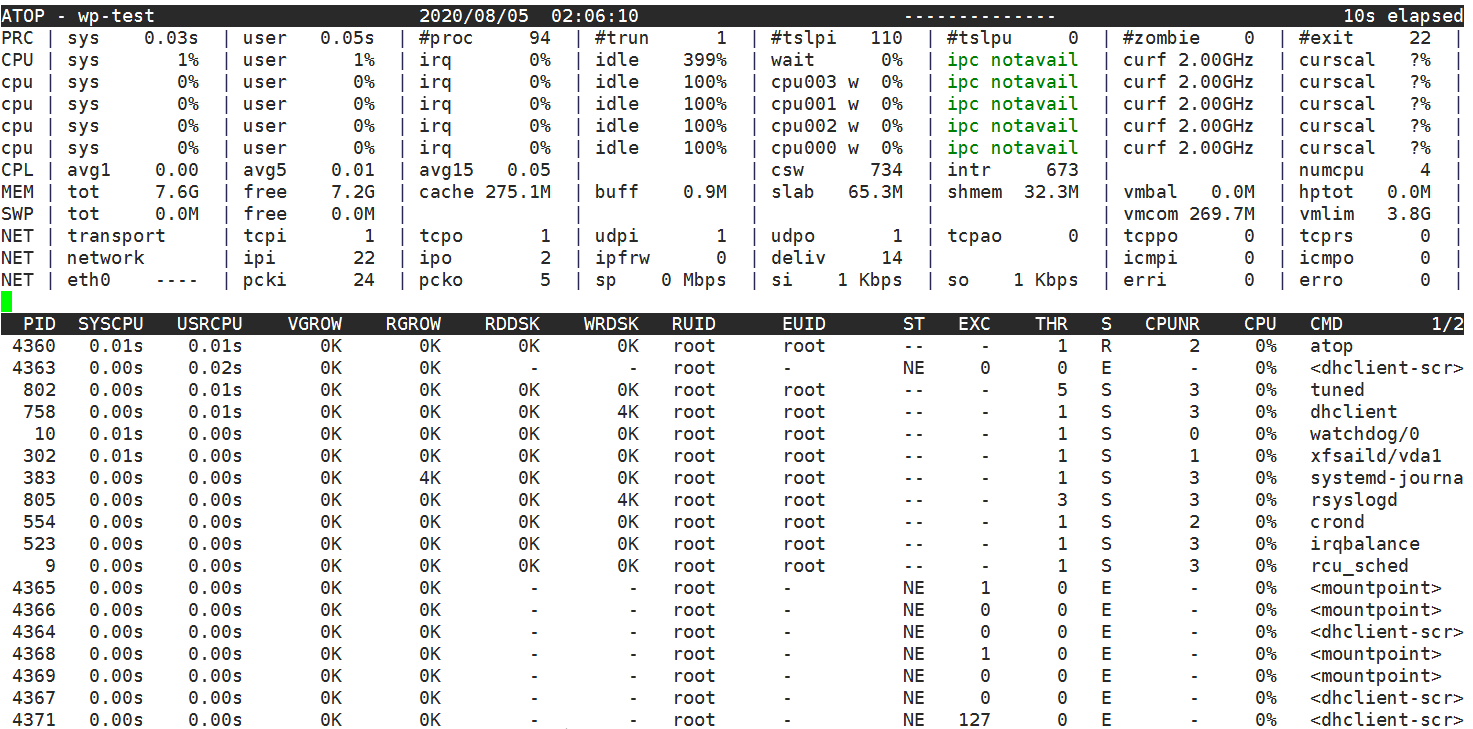
atop command is a terminal environment monitoring command. It shows a combination of various system resources (CPU, memory, network, I/O, kernel) and is color-coded under high load conditions.
$ sudo atop

3.free
The free command is a quick way to view memory usage and is an overview of the information collected by /proc/meminfo.
$ free -h
4.GNOME System Monitor
GNOME System Monitor is a view tool that displays the usage of CPU, memory, swap area and network in the recent period. It also provides a way to view CPU and memory usage.
$ gnome-system-monitor
5.htop
htop command displays the real-time memory usage of each process. It provides reports on the resident memory size of all processes, total program memory size, shared library size, etc. The list can be scrolled horizontally and vertically.
$ htop
6.KDE System Monitor
The functions are the same as the GENOME version introduced in 4.
$ ksysguard
7.memstat
memstat is a command that effectively identifies virtual memory usage by executable(s), process(es) and shared libraries. Given a process ID, memstat can list the executable files, data, and shared libraries associated with this process.
$ memstat -p
8.nmon
nmon is a system benchmarking tool based on ncurses, which can monitor the interactive mode of CPU, memory, I/O, file system and network resources. For memory usage, it can display total/remaining memory, swap space and other information in real time.
$ nmon
9.ps
ps command can display the memory usage of each process in real time. Reported memory usage information includes %MEM (percent of physical memory used), VSZ (totalamount of virtual memory used), and RSS (total amount of physical memory used). You can use the "-sort" option to sort processes, for example by RSS:
$ ps aux | sort -rss
Figure 8: Summary of methods to check memory usage under Linux
10.smem
The smem command allows you to count the memory usage of different processes and users based on /proc information. Analysis of memory usage can export charts (such as bar charts and pie charts).
smem  -P sshd -k
  PID User     Command                         Swap      USS      PSS      RSS
  815 root     /usr/sbin/sshd                     0   868.0K   951.0K     1.3M
14104 root     sshd: root@pts/0                   0     2.8M     3.5M     5.3M
14292 root     python /usr/bin/smem -P ssh        0     5.1M     5.8M     7.2M
11.top
The top command provides real-time resource usage statistics of running programs. You can sort based on memory usage and size.
$ top
12.vmstat
The vmstat command displays real-time and average statistics covering CPU, memory, I/O, etc. For example, memory status not only displays physical memory, but also counts virtual memory.
Through the study of this article, you have already understood the basic principles of Linux memory management, memory classification, viewing memory usage, and how to optimize system memory. At the same time, we also shared some practical memory management tools and techniques to help you further improve system performance and operating efficiency. I hope this article can inspire and help you!
The above is the detailed content of Summarize the various methods of checking memory usage under Linux. For more information, please follow other related articles on the PHP Chinese website!

Hot AI Tools

Undresser.AI Undress
AI-powered app for creating realistic nude photos

AI Clothes Remover
Online AI tool for removing clothes from photos.

Undress AI Tool
Undress images for free

Clothoff.io
AI clothes remover

AI Hentai Generator
Generate AI Hentai for free.

Hot Article

Hot Tools

Notepad++7.3.1
Easy-to-use and free code editor

SublimeText3 Chinese version
Chinese version, very easy to use

Zend Studio 13.0.1
Powerful PHP integrated development environment

Dreamweaver CS6
Visual web development tools

SublimeText3 Mac version
God-level code editing software (SublimeText3)

Hot Topics
 1359
1359
 52
52
 deepseek web version entrance deepseek official website entrance
Feb 19, 2025 pm 04:54 PM
DeepSeek is a powerful intelligent search and analysis tool that provides two access methods: web version and official website. The web version is convenient and efficient, and can be used without installation; the official website provides comprehensive product information, download resources and support services. Whether individuals or corporate users, they can easily obtain and analyze massive data through DeepSeek to improve work efficiency, assist decision-making and promote innovation.
 How to install deepseek
Feb 19, 2025 pm 05:48 PM
There are many ways to install DeepSeek, including: compile from source (for experienced developers) using precompiled packages (for Windows users) using Docker containers (for most convenient, no need to worry about compatibility) No matter which method you choose, Please read the official documents carefully and prepare them fully to avoid unnecessary trouble.
 Get the gate.io installation package for free
Feb 21, 2025 pm 08:21 PM
Gate.io is a popular cryptocurrency exchange that users can use by downloading its installation package and installing it on their devices. The steps to obtain the installation package are as follows: Visit the official website of Gate.io, click "Download", select the corresponding operating system (Windows, Mac or Linux), and download the installation package to your computer. It is recommended to temporarily disable antivirus software or firewall during installation to ensure smooth installation. After completion, the user needs to create a Gate.io account to start using it.
 BITGet official website installation (2025 beginner's guide)
Feb 21, 2025 pm 08:42 PM
BITGet is a cryptocurrency exchange that provides a variety of trading services including spot trading, contract trading and derivatives. Founded in 2018, the exchange is headquartered in Singapore and is committed to providing users with a safe and reliable trading platform. BITGet offers a variety of trading pairs, including BTC/USDT, ETH/USDT and XRP/USDT. Additionally, the exchange has a reputation for security and liquidity and offers a variety of features such as premium order types, leveraged trading and 24/7 customer support.
 Ouyi okx installation package is directly included
Feb 21, 2025 pm 08:00 PM
Ouyi OKX, the world's leading digital asset exchange, has now launched an official installation package to provide a safe and convenient trading experience. The OKX installation package of Ouyi does not need to be accessed through a browser. It can directly install independent applications on the device, creating a stable and efficient trading platform for users. The installation process is simple and easy to understand. Users only need to download the latest version of the installation package and follow the prompts to complete the installation step by step.
 How to solve the permissions problem encountered when viewing Python version in Linux terminal?
Apr 01, 2025 pm 05:09 PM
Solution to permission issues when viewing Python version in Linux terminal When you try to view Python version in Linux terminal, enter python...
 Ouyi Exchange Download Official Portal
Feb 21, 2025 pm 07:51 PM
Ouyi, also known as OKX, is a world-leading cryptocurrency trading platform. The article provides a download portal for Ouyi's official installation package, which facilitates users to install Ouyi client on different devices. This installation package supports Windows, Mac, Android and iOS systems. Users can choose the corresponding version to download according to their device type. After the installation is completed, users can register or log in to the Ouyi account, start trading cryptocurrencies and enjoy other services provided by the platform.
 How to automatically set permissions of unixsocket after system restart?
Mar 31, 2025 pm 11:54 PM
How to automatically set the permissions of unixsocket after the system restarts. Every time the system restarts, we need to execute the following command to modify the permissions of unixsocket: sudo...


