

The gospel of debugging C programs in Linux - gdb

Every programmer, no matter how experienced, cannot completely avoid bugs in software. Therefore, troubleshooting and fixing bugs has become one of the most crucial tasks in the software development cycle. While there are many ways to troubleshoot bugs, such as testing and code self-review, specialized debugger software can also help pinpoint the problem so it can be fixed.
For programmers who use the C/C programming language or Fortran and Modula-2 to develop software, there is an excellent debugger tool-GDB, which will be good news to them. GDB not only helps programmers debug bugs and other problems in their code more easily, but it also provides many useful features and options. In this article, we will discuss some basics of the GDB debugger, as well as some of the useful features and options it provides.
Before we begin, it’s worth mentioning that all instructions and examples in the article have been tested on Ubuntu 14.04 LTS. The sample codes in the tutorial are all written in C language; the shell used is bash (4.3.11); the GDB version is 7.7.1.
GDB Debugger Basics
In layman's terms, GDB allows you to see the internal flow of the program during execution and help you identify the problem. We'll discuss the use of the GDB debugger with a working example in the next section, but before that, let's cover some basic points that will help you later.
First of all, in order to successfully use a debugger like GDB, you must compile the program in a specified way so that the compiler generates the debugging information required by the debugger. For example, when compiling code with the gcc compiler (which we will use to compile the C program examples later in this tutorial), you need to use the -g command line option.
To learn about the -g command line option in the gcc compiler man page, please see here.
Next step, make sure the GDB debugger is installed on your system. If it is not installed and you are using a Debian-based system (such as Ubuntu), then you can easily install the tool using the following command:
sudo apt-get install gdb
For installation methods on other distributions, please see here.
Now, when you have compiled the program as described above (gcc -g command line option) and installed the GDB debugger, you can use the following command to run the program in debug mode:
gdb [可执行程序的名称]
Doing this will initialize the GDB debugger, but your executable program will not be started at this time. At this point you can define debugging related settings. For example, you can set a breakpoint at a specific line or function to have GDB pause program execution at that line.
Next, in order to start your program, you must enter and execute the following gdb command:
run
Here, it is worth mentioning that if your program requires some command line parameters, then you can specify these parameters here. For example:
run [参数]
GDB provides many useful commands, which can always come in handy when debugging. We will discuss some of these commands in the next section.
GDB debugger use case
Now we have a basic idea of GDB and its usage. So let’s apply what we’ve learned with an example. This is a sample code:
#include
int main()
{
    int out = 0, tot = 0, cnt = 0;
    int val[] = {5, 54, 76, 91, 35, 27, 45, 15, 99, 0};

    while(cnt printf("/n Total = [%d]/n", tot);
    return 0;
}
Briefly explain what this code does. Get each value in the val array, assign it to the out variable, then add the value before tot and the result value of 0xffffffff/out, and assign it to the tot variable.
The problem encountered here is that when the executable program compiled by this code is executed, the following error is generated:
$ ./gdb-testFloating point exception (core dumped)
So, to debug this code, the first step is to compile the program with the -g option. The command is as follows:
gcc -g -Wall gdb-test.c -o gdb-test
Next, let's run the GDB debugger and specify the executable program to debug. The command is as follows:
gdb ./gdb-test
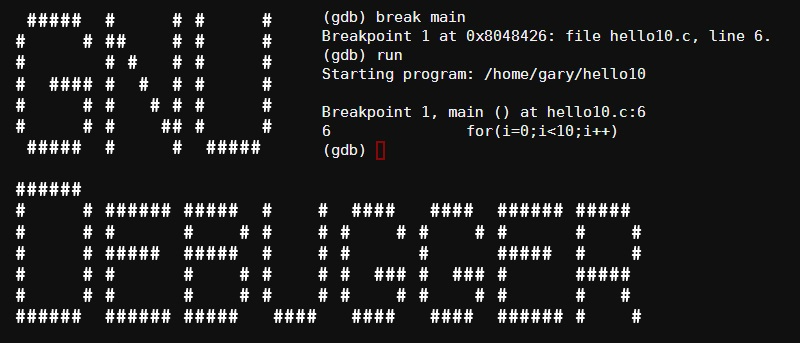
Now, the error I just got was a Floating point exception, which most of you probably already know, is caused by n % x when x is 0. So, with that in mind, I added a breakpoint at line 11 where the division operation occurs. as follows:
(gdb)&;break 11
Note (gdb) is the debugger prompt information, I only entered the break 11 command.
Now, let GDB start running the program:
run
When the breakpoint is hit for the first time, GDB displays the following output:
Breakpoint 1, main () at gdb-test.c:11
11 tot = tot + 0xffffffff/out;
(gdb)
As you can see, the debugger displays the line of code where the breakpoint is located. Now, let's print out the value of out at this time. as follows:
(gdb) print out
$1 = 5
(gdb)
如上所示,值 5被打印出来了。这个时候一切都还是正常的。让调试器继续执行程序直到命中下一个断点,可以通过使用 c 命令来完成:
c
重复上述操作,直到 out值变为0 时。
...
...
...
Breakpoint 1, main () at gdb-test.c:11
11 tot = tot + 0xffffffff/out;
(gdb) print out
$2 = 99
(gdb) c
Continuing.

Breakpoint 1, main () at gdb-test.c:11
11 tot = tot + 0xffffffff/out;
(gdb) print out
$3 = 0
(gdb)
现在,为了进一步确认问题,我使用 GDB 的s (或 step) 命令代替 c 命令。因为,我只想让当前程序在第 11 行之后暂停,再一步步执行,看看这个时候是否会发生崩溃。
以下是执行之后输出信息:
(gdb) s

Program received signal SIGFPE, Arithmetic exception.
0x080484aa in main () at gdb-test.c:11
11 tot = tot + 0xffffffff/out;
是的,如上输出的第一行内容所示,这就是抛出异常的地方。当我再次尝试运行s 命令时,问题最终也得到了确认:
(gdb) s

Program terminated with signal SIGFPE, Arithmetic exception.
The program no longer exists.
通过这种方式,你就可以使用 GDB 调试你的程序。
总结
GDB 提供了很多功能供用户研究和使用,在这里,我们仅仅只介绍了很少一部分内容。通过 GDB 的手册页可以进一步了解这个工具,当你在调试代码的时候,尝试使用一下它。GDB 调试器有一定的学习难度,但是它很值得你下功夫学习。
The above is the detailed content of The gospel of debugging C programs in Linux - gdb. For more information, please follow other related articles on the PHP Chinese website!

Hot AI Tools

Undresser.AI Undress
AI-powered app for creating realistic nude photos

AI Clothes Remover
Online AI tool for removing clothes from photos.

Undress AI Tool
Undress images for free

Clothoff.io
AI clothes remover

Video Face Swap
Swap faces in any video effortlessly with our completely free AI face swap tool!

Hot Article
Hot Tools

Notepad++7.3.1
Easy-to-use and free code editor

SublimeText3 Chinese version
Chinese version, very easy to use

Zend Studio 13.0.1
Powerful PHP integrated development environment

Dreamweaver CS6
Visual web development tools

SublimeText3 Mac version
God-level code editing software (SublimeText3)
Hot Topics
 1386
1386
 52
52

 How to use docker desktop
Apr 15, 2025 am 11:45 AM
How to use docker desktop
Apr 15, 2025 am 11:45 AM
How to use Docker Desktop? Docker Desktop is a tool for running Docker containers on local machines. The steps to use include: 1. Install Docker Desktop; 2. Start Docker Desktop; 3. Create Docker image (using Dockerfile); 4. Build Docker image (using docker build); 5. Run Docker container (using docker run).
 Difference between centos and ubuntu
Apr 14, 2025 pm 09:09 PM
Difference between centos and ubuntu
Apr 14, 2025 pm 09:09 PM
The key differences between CentOS and Ubuntu are: origin (CentOS originates from Red Hat, for enterprises; Ubuntu originates from Debian, for individuals), package management (CentOS uses yum, focusing on stability; Ubuntu uses apt, for high update frequency), support cycle (CentOS provides 10 years of support, Ubuntu provides 5 years of LTS support), community support (CentOS focuses on stability, Ubuntu provides a wide range of tutorials and documents), uses (CentOS is biased towards servers, Ubuntu is suitable for servers and desktops), other differences include installation simplicity (CentOS is thin)
 What to do if the docker image fails
Apr 15, 2025 am 11:21 AM
What to do if the docker image fails
Apr 15, 2025 am 11:21 AM
Troubleshooting steps for failed Docker image build: Check Dockerfile syntax and dependency version. Check if the build context contains the required source code and dependencies. View the build log for error details. Use the --target option to build a hierarchical phase to identify failure points. Make sure to use the latest version of Docker engine. Build the image with --t [image-name]:debug mode to debug the problem. Check disk space and make sure it is sufficient. Disable SELinux to prevent interference with the build process. Ask community platforms for help, provide Dockerfiles and build log descriptions for more specific suggestions.
 How to view the docker process
Apr 15, 2025 am 11:48 AM
How to view the docker process
Apr 15, 2025 am 11:48 AM
Docker process viewing method: 1. Docker CLI command: docker ps; 2. Systemd CLI command: systemctl status docker; 3. Docker Compose CLI command: docker-compose ps; 4. Process Explorer (Windows); 5. /proc directory (Linux).
 What computer configuration is required for vscode
Apr 15, 2025 pm 09:48 PM
What computer configuration is required for vscode
Apr 15, 2025 pm 09:48 PM
VS Code system requirements: Operating system: Windows 10 and above, macOS 10.12 and above, Linux distribution processor: minimum 1.6 GHz, recommended 2.0 GHz and above memory: minimum 512 MB, recommended 4 GB and above storage space: minimum 250 MB, recommended 1 GB and above other requirements: stable network connection, Xorg/Wayland (Linux)
 Detailed explanation of docker principle
Apr 14, 2025 pm 11:57 PM
Detailed explanation of docker principle
Apr 14, 2025 pm 11:57 PM
Docker uses Linux kernel features to provide an efficient and isolated application running environment. Its working principle is as follows: 1. The mirror is used as a read-only template, which contains everything you need to run the application; 2. The Union File System (UnionFS) stacks multiple file systems, only storing the differences, saving space and speeding up; 3. The daemon manages the mirrors and containers, and the client uses them for interaction; 4. Namespaces and cgroups implement container isolation and resource limitations; 5. Multiple network modes support container interconnection. Only by understanding these core concepts can you better utilize Docker.
 What is vscode What is vscode for?
Apr 15, 2025 pm 06:45 PM
What is vscode What is vscode for?
Apr 15, 2025 pm 06:45 PM
VS Code is the full name Visual Studio Code, which is a free and open source cross-platform code editor and development environment developed by Microsoft. It supports a wide range of programming languages and provides syntax highlighting, code automatic completion, code snippets and smart prompts to improve development efficiency. Through a rich extension ecosystem, users can add extensions to specific needs and languages, such as debuggers, code formatting tools, and Git integrations. VS Code also includes an intuitive debugger that helps quickly find and resolve bugs in your code.
 vscode cannot install extension
Apr 15, 2025 pm 07:18 PM
vscode cannot install extension
Apr 15, 2025 pm 07:18 PM
The reasons for the installation of VS Code extensions may be: network instability, insufficient permissions, system compatibility issues, VS Code version is too old, antivirus software or firewall interference. By checking network connections, permissions, log files, updating VS Code, disabling security software, and restarting VS Code or computers, you can gradually troubleshoot and resolve issues.
