

Top 7 Linux GPU Monitoring and Diagnostic Command Line Tools

A video card is a special circuit board used to control what is displayed on a computer monitor. It is also called a Graphics Processing Unit (GPU) and computes 3D images and graphics for Linux games and other purposes. Let’s take a look at the top 7 Linux GPU monitoring and diagnostics command line tools to solve your problems.
The following tools are available on Linux for GPU monitoring and diagnostic purposes, as well as on other operating systems such as FreeBSD. Today, most Linux and FreeBSD users use Nvidia, Intel, and AMD GPUs.
Linux GPU Monitoring and Diagnostic Command Line Tool
We can use the following tools to monitor, diagnose and inspect Linux or *BSD based systems.
To get graphics processor information just run:
linuxmi@linuxmi:~/www.linuxmi.com$ sudo lshw -C display -short
[sudo] linuxmi password:
The output is as follows:
H/W path                   Device      Class          Description
=================================================================
/0/100/f                               display        SVGA II Adapter
linuxmi@linuxmi:~/www.linuxmi.com$ lspci -v | more
1. glmark2 – Stress test GPU performance on Linux
glmark2 is an OpenGL 2.0 and ES 2.0 benchmark command line utility. We can install it by entering the following command:
linuxmi@linuxmi:~/www.linuxmi.com$ sudo apt install glmark2
Now, run as follows:
linuxmi@linuxmi:~/www.linuxmi.com$ glmark2
It will then start testing as follows and will stress test your GPU on Linux:
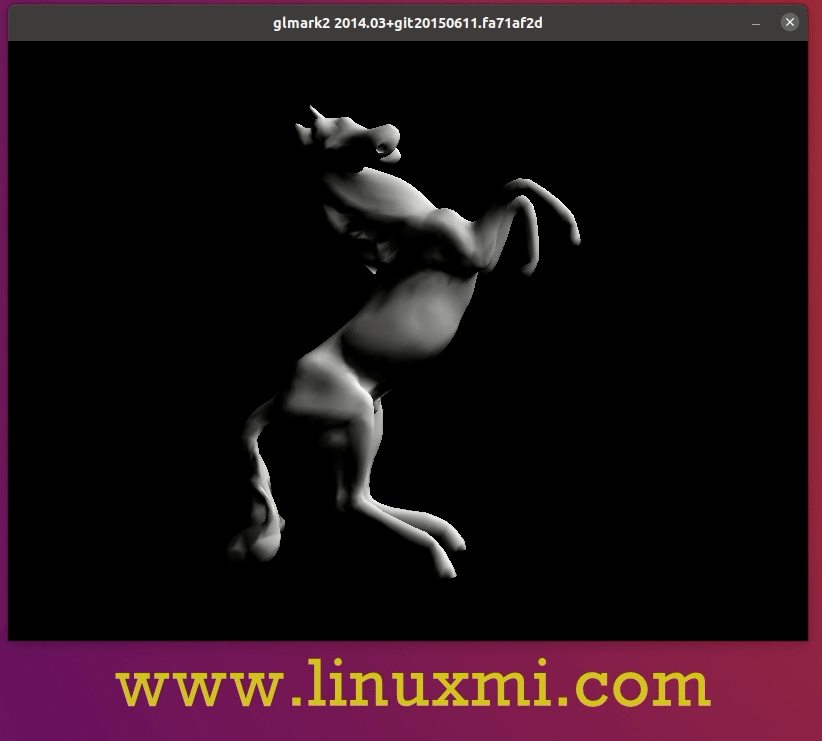
Linux glmark2 test screen
My benchmark results, running on Ubuntu Linux 20.04 LTS:
** GLX does not support GLX_EXT_swap_control or GLX_MESA_swap_control!
** Failed to set swap interval. Results may be bounded above by refresh rate.
=======================================================
    glmark2 2014.03+git20150611.fa71af2d
=======================================================
    OpenGL Information
    GL_VENDOR:     Mesa/X.org
    GL_RENDERER:   llvmpipe (LLVM 11.0.0, 256 bits)
    GL_VERSION:    3.1 Mesa 20.2.1
=======================================================
** GLX does not support GLX_EXT_swap_control or GLX_MESA_swap_control!
** Failed to set swap interval. Results may be bounded above by refresh rate.
[build] use-vbo=false: FPS: 150 FrameTime: 6.667 ms
** GLX does not support GLX_EXT_swap_control or GLX_MESA_swap_control!
** Failed to set swap interval. Results may be bounded above by refresh rate.
[build] use-vbo=true: FPS: 164 FrameTime: 6.098 ms
** GLX does not support GLX_EXT_swap_control or GLX_MESA_swap_control!
** Failed to set swap interval. Results may be bounded above by refresh rate.
[texture] texture-filter=nearest: FPS: 190 FrameTime: 5.263 ms
** GLX does not support GLX_EXT_swap_control or GLX_MESA_swap_control!
** Failed to set swap interval. Results may be bounded above by refresh rate.
[texture] texture-filter=linear: FPS: 172 FrameTime: 5.814 ms
=======================================================
                                  glmark2 Score: 169
=======================================================
2., glxgears – a simple Linux GPU performance testing tool
It will display a set of rotating gears and periodically print out the frame rate. It has become extremely popular as an essential benchmarking tool for Linux and Unix-like systems like FreeBSD. Install and run it as follows:
linuxmi@linuxmi:~/www.linuxmi.com$ sudo apt install mesa-utils
linuxmi@linuxmi:~/www.linuxmi.com$ glxgears
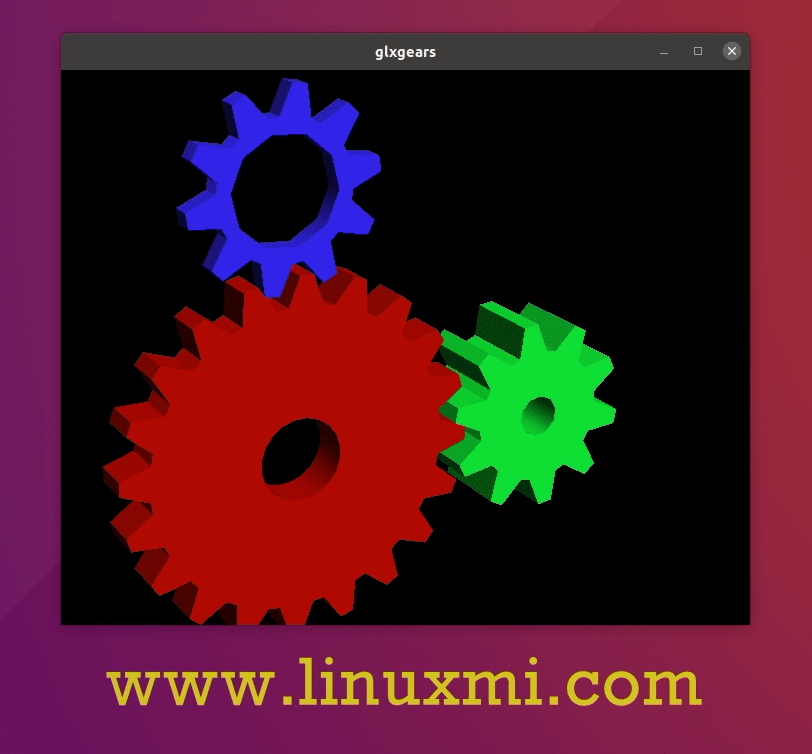
Measures the GPU frame rate every five seconds and publishes it to the screen. The final result will look like this:
4005 frames in 5.0 seconds = 800.123 FPS
1348 frames in 5.0 seconds = 269.529 FPS
1259 frames in 5.0 seconds = 251.788 FPS
1047 frames in 5.0 seconds = 209.265 FPS
651 frames in 5.0 seconds = 130.198 FPS
651 frames in 5.0 seconds = 130.070 FPS
759 frames in 5.0 seconds = 151.732 FPS
……
3. A simple tool to get Nvidia GPU statistics on Linux and FreeBSD Unix
It is written in Python and is the perfect tool for CLI users, especially ML/AI developers. It can be installed using PIP as follows:
linuxmi@linuxmi:~/www.linuxmi.com
pip3 install gpustat
Run as follows:
linuxmi@linuxmi:~/www.linuxmi.com$ gpustat
linuxmi@linuxmi:~/www.linuxmi.com$ gpustat -cp
View help:
linuxmi@linuxmi:~/www.linuxmi.com$ gpustat -h
4. intel_gpu_top – A top-like summary showing Intel GPU usage on Linux
First install the tool and run:
linuxmi@linuxmi:~/www.linuxmi.com$ sudo apt install intel-gpu-tools
## CentOS/RHEL/Fedora Linux users try dnf command
##linuxmi@linuxmi:~/www.linuxmi.com$ sudo dnf install intel-gpu-tools
Fedora, RHEL and CentOS Linux users can use the podman command to install as follows:
linuxmi@linuxmi:~/www.linuxmi.com$ podman run –rm –priviledged registry.freedesktop.org/drm/igt-gpu-tools/igt:master
The tool collects data using performance counters (PMUs) exposed by i915 and other platform drivers such as RAPL (power) and Uncore IMC (memory bandwidth). Run it as follows on a Linux system:
linuxmi@linuxmi:~/www.linuxmi.com$ sudo intel_gpu_top
5. nvidia-smi – NVIDIA system management interface program
nvidia-smi provides monitoring and management capabilities for the Fermi and higher architecture families of NVIDIA Tesla, Quadro, GRID and GeForce devices. Most features of GeForce Titan series devices are supported, while the remaining Geforce brand information is very limited. NVSMI is a cross-platform tool that supports all standard NVIDIA drivers supported by Linux and FreeBSD. After installing the Nvidia driver on Ubuntu Linux, follow these steps to install it:
linuxmi@linuxmi:~/www.linuxmi.com$sudo apt install nvidia-smi
Open the terminal and run:
linuxmi@linuxmi:~/www.linuxmi.com nvidia-smi -q -g 0 -d UTILIZATION -l 1
linuxmi@linuxmi:~/www.linuxmi.com sudo nvidia-smi
linuxmi@linuxmi:~/www.linuxmi.com nvidia-smi –help
\6. nvtop – NVIDIA GPU top
Another great but very useful NVIDIA GPU tool. Similar to htop command or top command, it is an ncurses-based GPU status viewer for NVIDIA GPUs. We can install it as follows:
linuxmi@linuxmi:~/www.linuxmi.com
apt install nvtop ## Run this attack linuxmi@linuxmi:~/www.linuxmi.comnvtop
7. radeontop – a tool to display AMD GPU utilization on Linux
View your AMD GPU utilization, both as a percentage of total activity and as an individual block on Linux. Install as follows:
linuxmi@linuxmi:~/www.linuxmi.com
sudo radeontop
It works with R600 and higher GPUs, even Southern Islands should work fine. Works with open source AMD drivers and AMD Catalyst clone source drivers.
Summarize
You now understand the various Linux GPU commands and tools used for monitoring and diagnostic purposes on Linux and BSD-based systems. If I missed your favorite tool, please let me know in the comments section below. Thanks. The above is the Linu system related content shared by Tutorial.com for all friends. If you want to learn more about Linux, remember to follow the official account "Linux", or scan the QR code below to follow. More useful information is waiting for you!
The above is the detailed content of Top 7 Linux GPU Monitoring and Diagnostic Command Line Tools. For more information, please follow other related articles on the PHP Chinese website!

Hot AI Tools

Undresser.AI Undress
AI-powered app for creating realistic nude photos

AI Clothes Remover
Online AI tool for removing clothes from photos.

Undress AI Tool
Undress images for free

Clothoff.io
AI clothes remover

AI Hentai Generator
Generate AI Hentai for free.

Hot Article
Hot Tools

Notepad++7.3.1
Easy-to-use and free code editor

SublimeText3 Chinese version
Chinese version, very easy to use

Zend Studio 13.0.1
Powerful PHP integrated development environment

Dreamweaver CS6
Visual web development tools

SublimeText3 Mac version
God-level code editing software (SublimeText3)
Hot Topics


 deepseek web version entrance deepseek official website entrance
Feb 19, 2025 pm 04:54 PM
deepseek web version entrance deepseek official website entrance
Feb 19, 2025 pm 04:54 PM
DeepSeek is a powerful intelligent search and analysis tool that provides two access methods: web version and official website. The web version is convenient and efficient, and can be used without installation; the official website provides comprehensive product information, download resources and support services. Whether individuals or corporate users, they can easily obtain and analyze massive data through DeepSeek to improve work efficiency, assist decision-making and promote innovation.
 How to install deepseek
Feb 19, 2025 pm 05:48 PM
How to install deepseek
Feb 19, 2025 pm 05:48 PM
There are many ways to install DeepSeek, including: compile from source (for experienced developers) using precompiled packages (for Windows users) using Docker containers (for most convenient, no need to worry about compatibility) No matter which method you choose, Please read the official documents carefully and prepare them fully to avoid unnecessary trouble.
 BITGet official website installation (2025 beginner's guide)
Feb 21, 2025 pm 08:42 PM
BITGet official website installation (2025 beginner's guide)
Feb 21, 2025 pm 08:42 PM
BITGet is a cryptocurrency exchange that provides a variety of trading services including spot trading, contract trading and derivatives. Founded in 2018, the exchange is headquartered in Singapore and is committed to providing users with a safe and reliable trading platform. BITGet offers a variety of trading pairs, including BTC/USDT, ETH/USDT and XRP/USDT. Additionally, the exchange has a reputation for security and liquidity and offers a variety of features such as premium order types, leveraged trading and 24/7 customer support.
 Ouyi okx installation package is directly included
Feb 21, 2025 pm 08:00 PM
Ouyi okx installation package is directly included
Feb 21, 2025 pm 08:00 PM
Ouyi OKX, the world's leading digital asset exchange, has now launched an official installation package to provide a safe and convenient trading experience. The OKX installation package of Ouyi does not need to be accessed through a browser. It can directly install independent applications on the device, creating a stable and efficient trading platform for users. The installation process is simple and easy to understand. Users only need to download the latest version of the installation package and follow the prompts to complete the installation step by step.
 Get the gate.io installation package for free
Feb 21, 2025 pm 08:21 PM
Get the gate.io installation package for free
Feb 21, 2025 pm 08:21 PM
Gate.io is a popular cryptocurrency exchange that users can use by downloading its installation package and installing it on their devices. The steps to obtain the installation package are as follows: Visit the official website of Gate.io, click "Download", select the corresponding operating system (Windows, Mac or Linux), and download the installation package to your computer. It is recommended to temporarily disable antivirus software or firewall during installation to ensure smooth installation. After completion, the user needs to create a Gate.io account to start using it.
 Ouyi Exchange Download Official Portal
Feb 21, 2025 pm 07:51 PM
Ouyi Exchange Download Official Portal
Feb 21, 2025 pm 07:51 PM
Ouyi, also known as OKX, is a world-leading cryptocurrency trading platform. The article provides a download portal for Ouyi's official installation package, which facilitates users to install Ouyi client on different devices. This installation package supports Windows, Mac, Android and iOS systems. Users can choose the corresponding version to download according to their device type. After the installation is completed, users can register or log in to the Ouyi account, start trading cryptocurrencies and enjoy other services provided by the platform.
 gate.io official website registration installation package link
Feb 21, 2025 pm 08:15 PM
gate.io official website registration installation package link
Feb 21, 2025 pm 08:15 PM
Gate.io is a highly acclaimed cryptocurrency trading platform known for its extensive token selection, low transaction fees and a user-friendly interface. With its advanced security features and excellent customer service, Gate.io provides traders with a reliable and convenient cryptocurrency trading environment. If you want to join Gate.io, please click the link provided to download the official registration installation package to start your cryptocurrency trading journey.
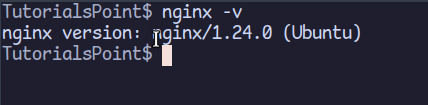 How to Install phpMyAdmin with Nginx on Ubuntu?
Feb 07, 2025 am 11:12 AM
How to Install phpMyAdmin with Nginx on Ubuntu?
Feb 07, 2025 am 11:12 AM
This tutorial guides you through installing and configuring Nginx and phpMyAdmin on an Ubuntu system, potentially alongside an existing Apache server. We'll cover setting up Nginx, resolving potential port conflicts with Apache, installing MariaDB (
