Linux memory management artifact: smem tool
Hi everybody, I'm.
Today I want to introduce to you a very practical memory management tool in Linux systems: smem.
smem is a command line tool that can generate a variety of memory usage reports. Unlike other existing tools, smem can report PSS (Proportional Set Size, proportional occupied size), which is a more meaningful metric. It accurately measures the amount of memory used by libraries and applications in a virtual memory system.
Traditionally, since most physical memory is often shared among multiple applications, using resident set size (RSS) as a measure of memory usage overestimates actual memory consumption. In contrast, the PSS parameter measures the memory allocated by each application in each shared memory region, which provides a more realistic and accurate metric.
1. Install smem tool
If you are using Fedora 19 or above, smem is in the repository by default, so you can install it using yum:
$ sudo yum install smem
For Ubuntu users, you can use the apt-get command to install smem:
$ sudo apt-get install smem
If it cannot be installed normally, you can download its source code and install it directly at the address: https://www.selenic.com/smem/download/
2. Common usage of smem tool
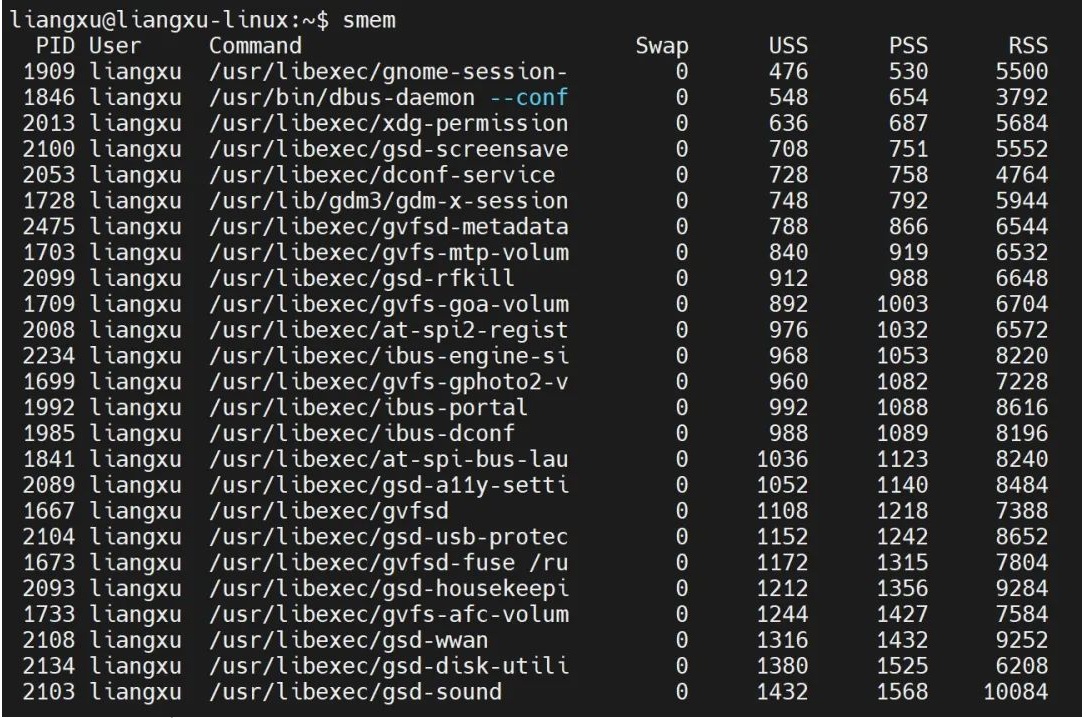
By default, smem will display each running process and the memory used. Here, you can note the size of RSS relative to USS and PSS, and you can see that it is significantly higher than the other two.
$ smem

In addition, smem can also display the memory used by each library. This result is relatively long and may take some time, depending on your system.
$ smem -m
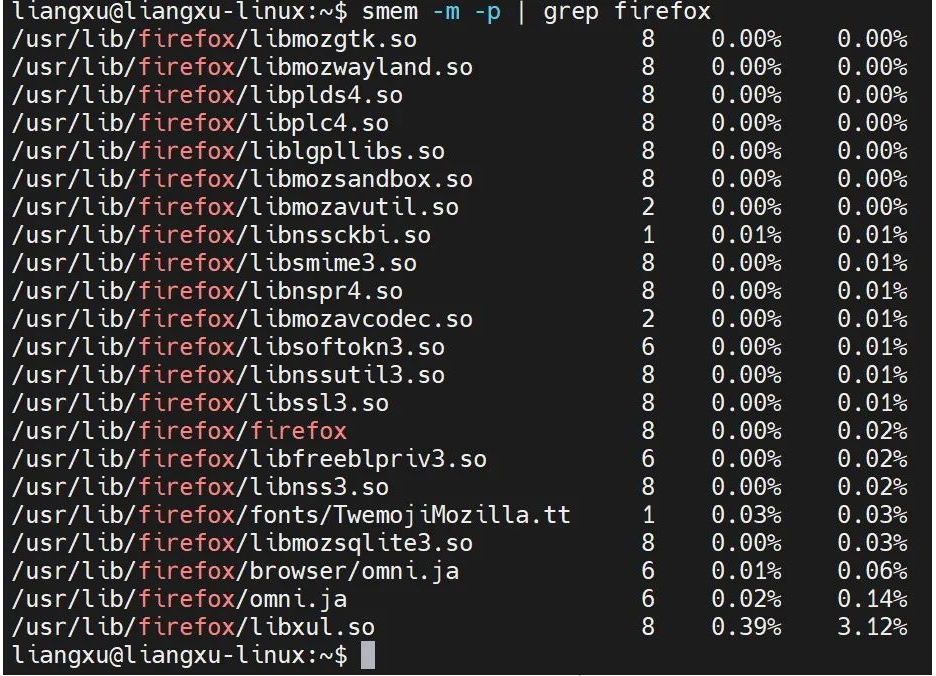
This command produces too many results. If we want to check the memory usage of a specific application, such as Firefox, then we can use it with the grep command and use -p## at the same time. # option to view memory usage as a percentage.
$ smem -m -p | grep firefox

smem The command can also display the memory usage of each user. You need to use the -u option:
$ smem -u -p

你还可以使用 -w 选项查看系统内存使用情况:
$ smem -w -p

3. 结果可视化输出
显示数字毕竟不直观,我们还可以使用 smem 生成图形图表来显示内存使用情况,一目了然。要达到这个目的,我们需要使用到除了不能生孩子啥都可以干的 Python 。
但光有 Python 还不行,还需要安装用于生成图表的 matplotlib 库。
Fedora 用户可以通过运行以下命令来安装它:
$ sudo yum install python-matplotlib
Ubuntu 用户可以通过运行下面命令获得它:
$ sudo apt-get install python-matplotlib
库安装之后,现在就可以以条形图或饼图的形式将获得的内存使用情况以可视化表示。
3.1 饼形图
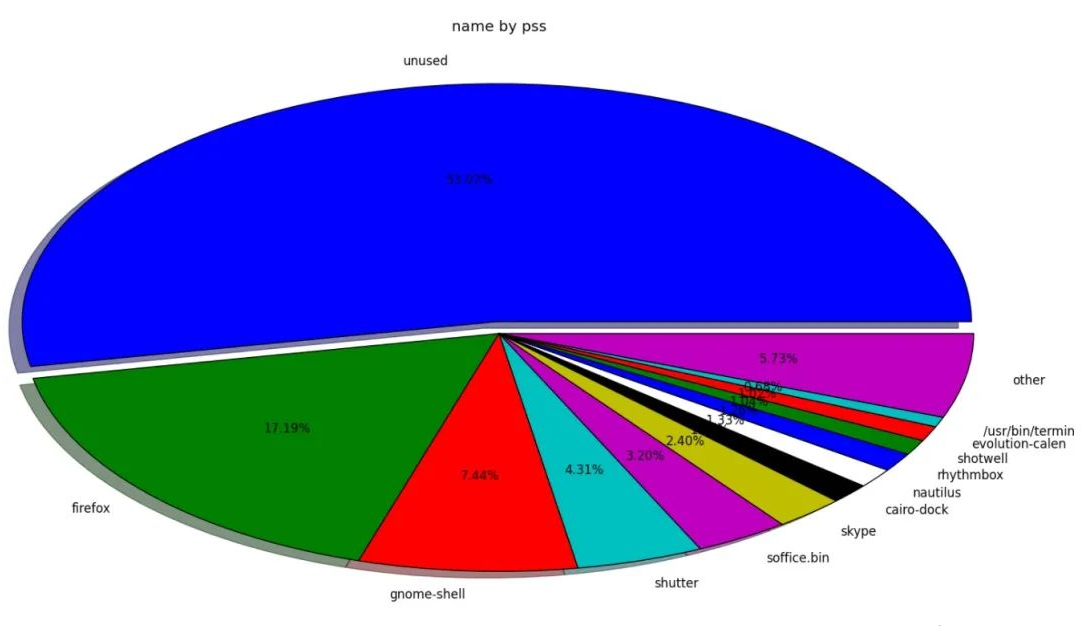
使用 smem 以饼图的形式查看内存使用情况,需要加上 --pie 选项,如下所示:
$ smem --pie name -s pss
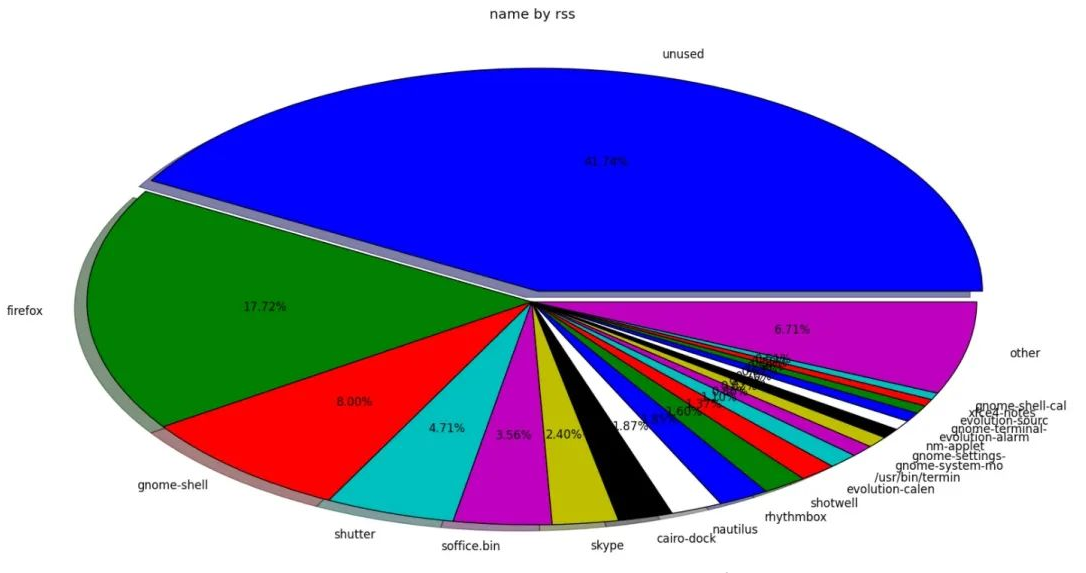
命令运行之后将生成一个饼图。请注意,这条命令里我们还加了 -s pss ,意思是显示 PSS 的内存使用情况。要获取 USS 和 RSS 的饼图,只需将命令中的 pss 替换为 uss 或 rss 即可。


从两个饼图中,可以看到 RSS 报告还有 41.74% 的未使用内存,而 PSS 报告有 53.02% 的未使用内存。可以看出来,RSS 显示的可用内存偏小,但实际还有很充足的内存空间。
3.2 柱状图
smem 的另一个很酷的特性是以柱状图的形式生成输出。有了这个功能,你可以一次性查看 USS、PSS 和 RSS 报告的内存使用情况。
要实现这个功能,需要加上 --bar 选项:
$ smem --bar pid -c "pss uss rss"
上面的命令将给出带有进程 ID 号的内存使用情况的输出结果。如果想要查看进程的名称,可以将 pid 替换为 name 即可。
命令运行之后,可以生成如下图所示的条柱状图。

The above is the detailed content of Linux memory management artifact: smem tool. For more information, please follow other related articles on the PHP Chinese website!

Hot AI Tools

Undresser.AI Undress
AI-powered app for creating realistic nude photos

AI Clothes Remover
Online AI tool for removing clothes from photos.

Undress AI Tool
Undress images for free

Clothoff.io
AI clothes remover

AI Hentai Generator
Generate AI Hentai for free.

Hot Article

Hot Tools

Notepad++7.3.1
Easy-to-use and free code editor

SublimeText3 Chinese version
Chinese version, very easy to use

Zend Studio 13.0.1
Powerful PHP integrated development environment

Dreamweaver CS6
Visual web development tools

SublimeText3 Mac version
God-level code editing software (SublimeText3)

Hot Topics
 deepseek web version entrance deepseek official website entrance
Feb 19, 2025 pm 04:54 PM
DeepSeek is a powerful intelligent search and analysis tool that provides two access methods: web version and official website. The web version is convenient and efficient, and can be used without installation; the official website provides comprehensive product information, download resources and support services. Whether individuals or corporate users, they can easily obtain and analyze massive data through DeepSeek to improve work efficiency, assist decision-making and promote innovation.
 How to install deepseek
Feb 19, 2025 pm 05:48 PM
There are many ways to install DeepSeek, including: compile from source (for experienced developers) using precompiled packages (for Windows users) using Docker containers (for most convenient, no need to worry about compatibility) No matter which method you choose, Please read the official documents carefully and prepare them fully to avoid unnecessary trouble.
 BITGet official website installation (2025 beginner's guide)
Feb 21, 2025 pm 08:42 PM
BITGet is a cryptocurrency exchange that provides a variety of trading services including spot trading, contract trading and derivatives. Founded in 2018, the exchange is headquartered in Singapore and is committed to providing users with a safe and reliable trading platform. BITGet offers a variety of trading pairs, including BTC/USDT, ETH/USDT and XRP/USDT. Additionally, the exchange has a reputation for security and liquidity and offers a variety of features such as premium order types, leveraged trading and 24/7 customer support.
 Ouyi okx installation package is directly included
Feb 21, 2025 pm 08:00 PM
Ouyi OKX, the world's leading digital asset exchange, has now launched an official installation package to provide a safe and convenient trading experience. The OKX installation package of Ouyi does not need to be accessed through a browser. It can directly install independent applications on the device, creating a stable and efficient trading platform for users. The installation process is simple and easy to understand. Users only need to download the latest version of the installation package and follow the prompts to complete the installation step by step.
 Get the gate.io installation package for free
Feb 21, 2025 pm 08:21 PM
Gate.io is a popular cryptocurrency exchange that users can use by downloading its installation package and installing it on their devices. The steps to obtain the installation package are as follows: Visit the official website of Gate.io, click "Download", select the corresponding operating system (Windows, Mac or Linux), and download the installation package to your computer. It is recommended to temporarily disable antivirus software or firewall during installation to ensure smooth installation. After completion, the user needs to create a Gate.io account to start using it.
 Ouyi Exchange Download Official Portal
Feb 21, 2025 pm 07:51 PM
Ouyi, also known as OKX, is a world-leading cryptocurrency trading platform. The article provides a download portal for Ouyi's official installation package, which facilitates users to install Ouyi client on different devices. This installation package supports Windows, Mac, Android and iOS systems. Users can choose the corresponding version to download according to their device type. After the installation is completed, users can register or log in to the Ouyi account, start trading cryptocurrencies and enjoy other services provided by the platform.
 gate.io official website registration installation package link
Feb 21, 2025 pm 08:15 PM
Gate.io is a highly acclaimed cryptocurrency trading platform known for its extensive token selection, low transaction fees and a user-friendly interface. With its advanced security features and excellent customer service, Gate.io provides traders with a reliable and convenient cryptocurrency trading environment. If you want to join Gate.io, please click the link provided to download the official registration installation package to start your cryptocurrency trading journey.
 How to Install phpMyAdmin with Nginx on Ubuntu?
Feb 07, 2025 am 11:12 AM
This tutorial guides you through installing and configuring Nginx and phpMyAdmin on an Ubuntu system, potentially alongside an existing Apache server. We'll cover setting up Nginx, resolving potential port conflicts with Apache, installing MariaDB (


