

How to monitor Linux with a 10-line bash shell script?

监控我们的环境对于服务器运维至关重要,特别是在部署新应用程序时。如今,许多公司每天都在使用开源解决方案来监控系统资源。但是,当我们需要在一段时间内进行测试监控时,bash脚本就会派上用场。
在本教程中,我们将编写一个bash shell脚本,它将输出一个三列表,显示我们计算机上内存、磁盘和CPU的百分比使用情况。
让我们开始吧!
这个脚本主要由三个部分组成:
1. 监控内存:
free -m | awk 'NR==2{printf "%.2f%%\t\t", $3*100/$2 }'
9.24%
free -m 是用于显示已使用和空闲内存的命令,输出如下:
[root@localhost tmp]# free -m
             total       used       free     shared    buffers     cached
Mem:           996         92        904          0         11         31
-/+ buffers/cache:         49        947
Swap:         1583          0       1583
但是,我们需要从上面的输出中获取第二行的总内存和已用内存。我们可以使用 AWK 来从给定输出中提取数据。
AWK 是一种用于文本处理和数据提取的编程语言。它是大多数 UNIX 系统的标准功能。awk ‘NR==2’ 从第二行提取数据。$3 和 $2 分别充当已用量和总量。
监控磁盘
df -h | awk '$NF=="/"{printf "%s\t\t", $5}'
7%
第二个命令输出使用的磁盘百分比。df -h 输出与磁盘使用情况和分区相关的数据。
[root@localhost tmp]# df -h
Filesystem                    Size  Used Avail Use% Mounted on
/dev/mapper/VolGroup-lv_root   14G  814M   12G   7% /
tmpfs                         499M     0  499M   0% /dev/shm
/dev/sda1                     485M   32M  428M   7% /boot
awk $NF 输出字段数。但是,df -h | awk '$NF=="/" 将转到包含字符 / 的那一行。$5 将从该行中选择第 5 个字段。这可确保该命令能够提取正确的磁盘使用百分比(在我们的示例中为 %7)。
监控 CPU
top -bn1 | grep load | awk '{printf "%.2f%%\t\t\n", $(NF-2)}'
top -bn1 命令将只执行一次 top 命令(n1 = 一次迭代),当我们想在 bash 脚本中使用 top 或将其数据输出到文件时使用可以使用 -b 选项。
grep load 将输出包含字符串 load 的行。$(NF-2) 将计算该行上的字段数并减 2。
[root@localhost tmp]# top -bn1 | grep load
top - 19:31:25 up  1:47,  1 user,  load average: 0.00, 0.00, 0.00
在浏览完 bash 脚本的基本部分之后,我们需要将这些命令保存到变量 MEMORY、DISK 和 CPU 中:
MEMORY=$(free -m | awk 'NR==2{printf "%.2f%%\t\t", $3*100/$2 }')
DISK=$(df -h | awk '$NF=="/"{printf "%s\t\t", $5}')
CPU=$(top -bn1 | grep load | awk '{printf "%.2f%%\t\t\n", $(NF-2)}')
我们需要脚本运行一段时间(比如,一个小时)。为了做到这一点,我们需要使用 while do 循环,每次循环后延迟 x 秒(取决于您的测试):
end=$((SECONDS+3600))
while [ $SECONDS -lt $end ]; do
echo "$MEMORY$DISK$CPU"
sleep 5
done
为了在一定时间内运行一次循环,我们可以定义一个变量 $end,它从 bash 脚本开始的时间开始计算当前的秒数,因此是 SECONDS,并在当前秒数上加上一个数字。所以一个小时就是 3600 秒。
上述代码片段的第二行指出,只要$SECONDS(当前秒数)小于 $SECONDS+3600,while 循环就会继续执行。因此,我们定义了循环的开始时间和结束时间,以及将每个循环暂停 5 秒的睡眠时间。循环内部是每 5 秒将那三个变量分配一次新值,以及将输出三个资源使用情况的 echo "$MEMORY$DISK$CPU"。
完整代码如下:
#! /bin/bash
printf "Memory\t\tDisk\t\tCPU\n"
end=$((SECONDS+3600))
while [ $SECONDS -lt $end ]; do
MEMORY=$(free -m | awk 'NR==2{printf "%.2f%%\t\t", $3*100/$2 }')
DISK=$(df -h | awk '$NF=="/"{printf "%s\t\t", $5}')
CPU=$(top -bn1 | grep load | awk '{printf "%.2f%%\t\t\n", $(NF-2)}')
echo "$MEMORY$DISK$CPU"
sleep 5
done
上面的代码将输出以下内容:
[root@localhost tmp]# ./stats.sh
Memory Disk CPU
9.34% 7% 0.00%
9.34% 7% 0.00%
9.34% 7% 0.00%
9.34% 7% 0.00%
^C[root@localhost tmp]#
您始终可以将数据输出到日志文件:
[root@localhost tmp]# ./stats.sh >> log.txt
Stress 测试
由于机器上几乎没有任何负载,我们可以使用 stress 来使 CPU 和内存负载一段时间。
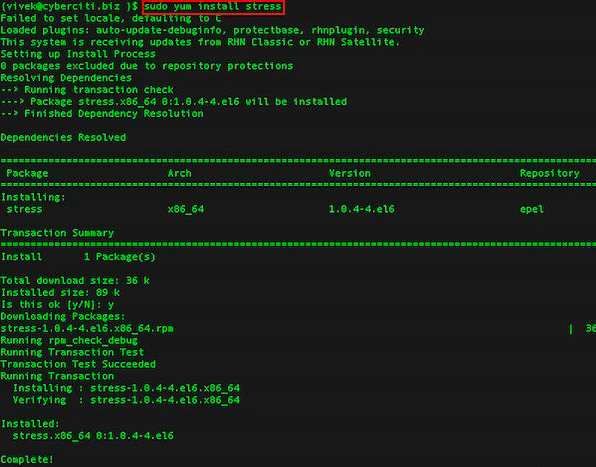
使用以下命令安装(在 CentOS 上):
[root@localhost tmp]# yum install stress
Failed to set locale, defaulting to C
Loaded plugins: fastestmirror
Determining fastest mirrors
epel/metalink                                                               | 4.2 kB     00:00
 * base: ba.mirror.garr.it
 * epel: ftp.riken.jp
 * extras: centos.fastbull.org
 * updates: centos.fastbull.org
base                                                                        | 3.7 kB     00:00
epel                                                                        | 4.3 kB     00:00
epel/primary_db                                                             | 5.9 MB     00:37
extras                                                                      | 3.4 kB     00:00
extras/primary_db                                                           |  37 kB     00:00
updates                                                                     | 3.4 kB     00:00
updates/primary_db                                                          | 5.2 MB     00:30
Setting up Install Process
Resolving Dependencies
--> Running transaction check
---> Package stress.x86_64 0:1.0.4-4.el6 will be installed
--> Finished Dependency Resolution
Dependencies Resolved
===================================================================================================
 Package               Arch                  Version                     Repository           Size
===================================================================================================
Installing:
 stress                x86_64                1.0.4-4.el6                 epel                 36 k
Transaction Summary
===================================================================================================
Install       1 Package(s)
Total download size: 36 k
Installed size: 89 k
Is this ok [y/N]: y
Downloading Packages:
stress-1.0.4-4.el6.x86_64.rpm                                               |  36 kB     00:01
Running rpm_check_debug
Running Transaction Test
Transaction Test Succeeded
Running Transaction
  Installing : stress-1.0.4-4.el6.x86_64                                                       1/1
  Verifying  : stress-1.0.4-4.el6.x86_64                                                       1/1
Installed:
  stress.x86_64 0:1.0.4-4.el6
Complete!
现在我们可以使用命令 stress 来负载我们的机器。例如,通过指定两个 CPU 密集型进程、一个 I/O 密集型进程和一个内存分配器进程,对系统施加 4 个平均负载,如下所示。以下压力测试将运行 1 小时。
[root@localhost tmp]# stress -c 2 -i 1 -m 1 --vm-bytes 128M -t 3600s
stress: info: [1574] dispatching hogs: 2 cpu, 1 io, 1 vm, 0 hdd
stress: info: [1574] successful run completed in 3600s
[root@localhost tmp]# ./stats.sh
Memory  Disk  CPU
20.48%  7%  1.21%
20.48%  7%  1.02%
20.48%  7%  0.94%
21.89%  7%  1.18%
20.68%  7%  1.41%
22.09%  7%  1.62%
24.10%  7%  1.81%
24.90%  7%  1.98%
32.93%  7%  2.14%
30.32%  7%  2.29%
20.58%  7%  2.63%
27.91%  7%  2.82%
20.48%  7%  2.59%
20.48%  7%  2.38%
20.48%  7%  2.19%
20.48%  7%  2.02%
20.48%  7%  1.86%
关于如何为所有系统管理员创建一个非常容易且有用的 bash 脚本的教程到此结束。
The above is the detailed content of How to monitor Linux with a 10-line bash shell script?. For more information, please follow other related articles on the PHP Chinese website!

Hot AI Tools

Undresser.AI Undress
AI-powered app for creating realistic nude photos

AI Clothes Remover
Online AI tool for removing clothes from photos.

Undress AI Tool
Undress images for free

Clothoff.io
AI clothes remover

AI Hentai Generator
Generate AI Hentai for free.

Hot Article
Hot Tools

Notepad++7.3.1
Easy-to-use and free code editor

SublimeText3 Chinese version
Chinese version, very easy to use

Zend Studio 13.0.1
Powerful PHP integrated development environment

Dreamweaver CS6
Visual web development tools

SublimeText3 Mac version
God-level code editing software (SublimeText3)
Hot Topics
 1378
1378
 52
52

 How to start apache
Apr 13, 2025 pm 01:06 PM
How to start apache
Apr 13, 2025 pm 01:06 PM
The steps to start Apache are as follows: Install Apache (command: sudo apt-get install apache2 or download it from the official website) Start Apache (Linux: sudo systemctl start apache2; Windows: Right-click the "Apache2.4" service and select "Start") Check whether it has been started (Linux: sudo systemctl status apache2; Windows: Check the status of the "Apache2.4" service in the service manager) Enable boot automatically (optional, Linux: sudo systemctl
 What to do if the apache80 port is occupied
Apr 13, 2025 pm 01:24 PM
What to do if the apache80 port is occupied
Apr 13, 2025 pm 01:24 PM
When the Apache 80 port is occupied, the solution is as follows: find out the process that occupies the port and close it. Check the firewall settings to make sure Apache is not blocked. If the above method does not work, please reconfigure Apache to use a different port. Restart the Apache service.
 How to monitor Nginx SSL performance on Debian
Apr 12, 2025 pm 10:18 PM
How to monitor Nginx SSL performance on Debian
Apr 12, 2025 pm 10:18 PM
This article describes how to effectively monitor the SSL performance of Nginx servers on Debian systems. We will use NginxExporter to export Nginx status data to Prometheus and then visually display it through Grafana. Step 1: Configuring Nginx First, we need to enable the stub_status module in the Nginx configuration file to obtain the status information of Nginx. Add the following snippet in your Nginx configuration file (usually located in /etc/nginx/nginx.conf or its include file): location/nginx_status{stub_status
 How to set up a recycling bin in Debian system
Apr 12, 2025 pm 10:51 PM
How to set up a recycling bin in Debian system
Apr 12, 2025 pm 10:51 PM
This article introduces two methods of configuring a recycling bin in a Debian system: a graphical interface and a command line. Method 1: Use the Nautilus graphical interface to open the file manager: Find and start the Nautilus file manager (usually called "File") in the desktop or application menu. Find the Recycle Bin: Look for the Recycle Bin folder in the left navigation bar. If it is not found, try clicking "Other Location" or "Computer" to search. Configure Recycle Bin properties: Right-click "Recycle Bin" and select "Properties". In the Properties window, you can adjust the following settings: Maximum Size: Limit the disk space available in the Recycle Bin. Retention time: Set the preservation before the file is automatically deleted in the recycling bin
 How to restart the apache server
Apr 13, 2025 pm 01:12 PM
How to restart the apache server
Apr 13, 2025 pm 01:12 PM
To restart the Apache server, follow these steps: Linux/macOS: Run sudo systemctl restart apache2. Windows: Run net stop Apache2.4 and then net start Apache2.4. Run netstat -a | findstr 80 to check the server status.
 How to optimize the performance of debian readdir
Apr 13, 2025 am 08:48 AM
How to optimize the performance of debian readdir
Apr 13, 2025 am 08:48 AM
In Debian systems, readdir system calls are used to read directory contents. If its performance is not good, try the following optimization strategy: Simplify the number of directory files: Split large directories into multiple small directories as much as possible, reducing the number of items processed per readdir call. Enable directory content caching: build a cache mechanism, update the cache regularly or when directory content changes, and reduce frequent calls to readdir. Memory caches (such as Memcached or Redis) or local caches (such as files or databases) can be considered. Adopt efficient data structure: If you implement directory traversal by yourself, select more efficient data structures (such as hash tables instead of linear search) to store and access directory information
 How to solve the problem that apache cannot be started
Apr 13, 2025 pm 01:21 PM
How to solve the problem that apache cannot be started
Apr 13, 2025 pm 01:21 PM
Apache cannot start because the following reasons may be: Configuration file syntax error. Conflict with other application ports. Permissions issue. Out of memory. Process deadlock. Daemon failure. SELinux permissions issues. Firewall problem. Software conflict.
 How debian readdir integrates with other tools
Apr 13, 2025 am 09:42 AM
How debian readdir integrates with other tools
Apr 13, 2025 am 09:42 AM
The readdir function in the Debian system is a system call used to read directory contents and is often used in C programming. This article will explain how to integrate readdir with other tools to enhance its functionality. Method 1: Combining C language program and pipeline First, write a C program to call the readdir function and output the result: #include#include#include#includeintmain(intargc,char*argv[]){DIR*dir;structdirent*entry;if(argc!=2){
