

Performance tuning has always been one of the most important tasks for operation and maintenance engineers. If your production environment encounters slow system response, abnormal hard disk IO throughput, data processing speed lower than expected, or If system resources such as CPU, memory, hard disk, and network are exhausted for a long time, this article will really help you. If not, please save it first.

1, hdparm check hardness reading speed:
1 2 3 |
|
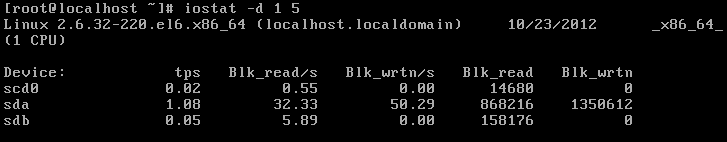
2, iostat detects disk IO status:
1 2 |
|
“
blk_read/s Number of data blocks read per second
blk_wrtn/s Number of data blocks written per second
blk_read represents the number of all data blocks read
blk_wrtn represents the number of all data blocks written
”
3, vmstat reports memory and CPU status:
1 2 |
|
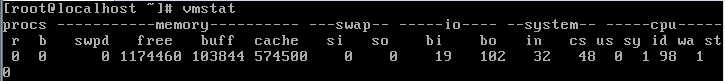
| R: | 运行和等待CPU时间片的进程数。If the number is greater than the CPU for a long time, it means that the CPU is insufficient |
|---|---|
| B: | The number of processes waiting for resources. If the number of waiting is large, the problem may be I/O or memory |
| Swpd: | Switch to the memory size of the memory swap area [in KB] |
| free: | The current amount of free physical memory [in KB] |
| si: | Transfer from disk to memory |
| so: | Transfer from memory to disk |
| bi: | The total amount of data read from the block device |
| bo: | The total amount of data written to the block device |
| bi bo | 1000 If it exceeds 1000, it means there is a problem with the read and write speed of the hard disk |
| in: | The number of device interrupts per second observed within a certain time interval [too many interrupts are bad for performance] |
| cs: | The column indicates the number of context switches generated per second |
| us sy > 80% | means insufficient CPU resources |
| us: | Percentage of CPU time consumed by user processes |
| sy: | Percentage of CPU time consumed by kernel processes |
| id: | Percentage of time the CPU is idle |
| wa: | Percentage of time spent waiting for IO |
| runq-sz: | The number of processes that can be run in memory |
| plist-sz: | The number of active tasks in the system |
显示详细信息
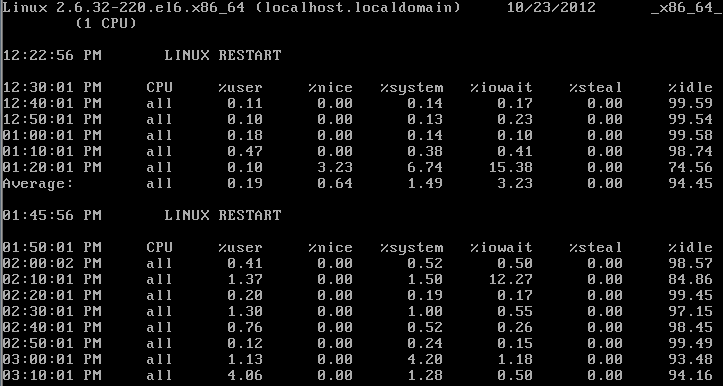
4,sar检测CPU资源:
1 2 3 |
|
5,lscpu显示CPU信息:
1 2 3 4 5 6 |
|
6,strace显示程序的调用:
1 |
|
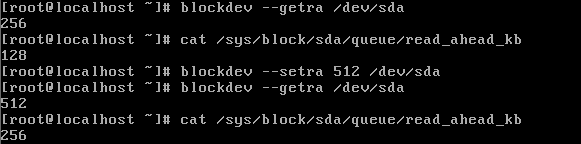
7,调优硬盘优先写入/读取数据用:
“
预先读取需要写入的量,然后再处理写请求,↑读到的值将会是设置值的一半↑。
设置读取到缓存中的数值越大.写入时就会因为数据量大而速度变慢。/sys/block/sda/queue/nr_requests 队列长度越大,硬盘IO速度会提升,但占用内存
/sys/block/sda/queue/scheduler 调度算法Noop、anticipatory、deadline、[cfq]”
8,将Ext3文件系统的日志功能独立:
“
1
2
3
4
5
6
7
1、创建200M的/dev/sdb1 格式化为ext3
2、dumpe2fs /dev/sdb1查看文件系统功能中包含的has_journal
3、Tune2fs –O ^has_journal /dev/sdb1 去掉默认原有的日志功能
4、再分一个200M的分区./dev/sdb2. 日志卷的block必须等于 /dev/sdb1
Mke2fs –O journal_dev –b 1024 /dev/sdb2
5、将/dev/sdb2作为/dev/sdb1的日志卷.
Tune2fs –j –J device=/dev/sdb2 /dev/sdb1Copy after login”
9,关闭记录文件系统atime:
1 2 |
|
10、修改文件日志的提交时间:
1 2 |
|
11,RAID轮循写入调优,适用于0/5/6:
“
chunk size.轮循一次写入的字节.默认是64K,只要没有写满,就不会移动到下一个设备
设置在每个硬盘都只写一个文件就切换到下一块硬盘,那么如果都是1K的小文件,就会将系统资源浪费在切换硬盘上
如果将chunk size的值设置很大,比如100M,那么也就没有了意义,还不如用一块硬盘。
Stripe size.条带大小,并不是有数据就写入,而是设置每次写入的数据量,一般是16K写一次。
所以.Chunk size(64K)/stripe size(16K),也就是说每块硬盘写四次。
————————————算当前应该把chunk size调成多少————————————
使用iostat –x查看自开机以来每秒的平均请求数avgrq-sz
chunk size = 每秒请求数*512/1024/磁盘数,取一个最紧接2倍数的整数
stride = chunk size /block(默认是4k)创建raid并设置chunk sinze
mdadm –C /dev/md0 –l 0 –n3 –chunk=8 /dev/sdb[123] 修改raid
mke2fs –j –b 4096 –E stride=2 /dev/md0”
12,硬盘的block保留数:
1 2 3 4 |
|
学习了上面的性能调优命令和方法后,再总结几条调优的金句:
独立设备性能速度比集成的强,因为不占用主机整体资源
工程师一般不会远程管理计算机,需要提供日志等信息
硬盘空间越大,读取的速度越慢,可以考虑用多块硬盘组成一块较大空间
分区只是在硬盘上做标识,而不像格式化在做文件系统特性,所以速度快
硬盘越靠外侧速度越快[分区号越小越靠外区,所以将数据量大的首先分区].
程序开发者注重雇主的功能要求,系统管理员注重程序的资源开销
The above is the detailed content of Take stock of 12 performance tuning commands in Linux systems.. For more information, please follow other related articles on the PHP Chinese website!


![[Web front-end] Node.js quick start](https://img.php.cn/upload/course/000/000/067/662b5d34ba7c0227.png)


