
 System Tutorial
LINUX
Efficient and easy, a powerful tool for system monitoring in Linux batch mode
System Tutorial
LINUX
Efficient and easy, a powerful tool for system monitoring in Linux batch mode
Efficient and easy, a powerful tool for system monitoring in Linux batch mode

In Linux systems, we often need to monitor and adjust system resources to ensure the normal operation and efficient use of the system. Using the top command is one of the most common system monitoring methods, but in actual operation, the interactive interface of the top command is not convenient, especially when the system running load is high, the real-time refresh of the top command will Bring additional system burden. This article will introduce a more efficient and easier system monitoring tool in Linux batch mode - the top command in batch mode.
The top command is used to display real-time processing activities in a Linux system, as well as kernel-managed tasks. It will show CPU and memory usage and other information such as running programs. You can take advantage of script mode options to transfer top command output to other applications or files.
How to use Top command script mode
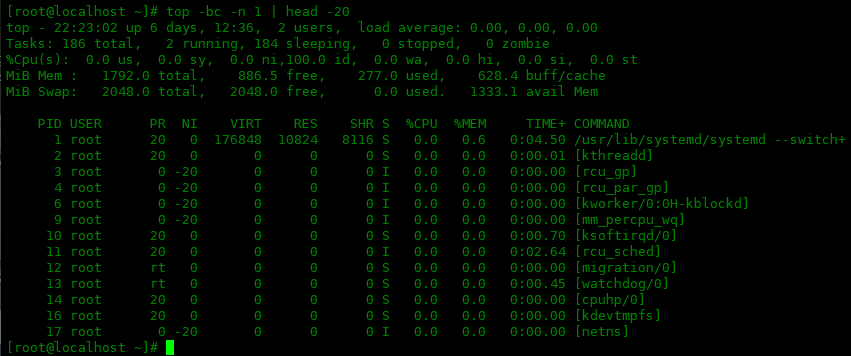
In Centos8, we execute the commands in this article. The following command sorts the data by CPU usage and prints the first 20 rows specified in the command.
1 2 3 4 5 6 7 8 9 10 11 12 13 14 15 16 17 18 19 20 21 22 |
|
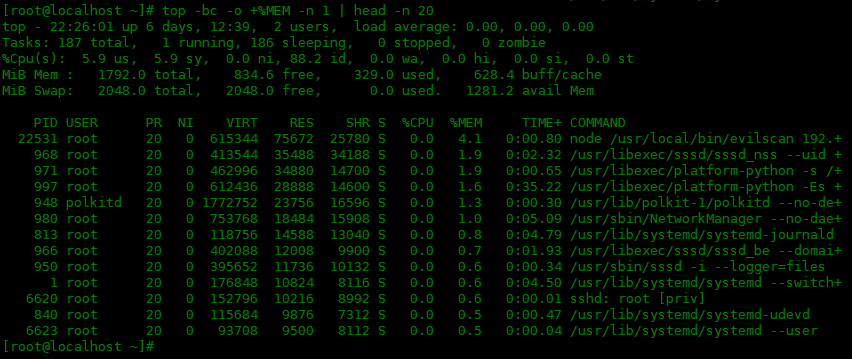
If you want to sort by memory usage, you need to use the following command:
1 2 3 4 5 6 7 8 9 10 11 12 13 14 15 16 17 18 19 20 21 22 23 24 25 26 27 28 29 30 31 32 33 |
|
The options used by the top command in the above command are explained as follows:
-
-b: Run script mode -
-c: Display the full path of the command in the COMMAND column -
-n: Specifies the maximum number of iterations that top should produce before ending. -
-o: Defines which field to sort by.
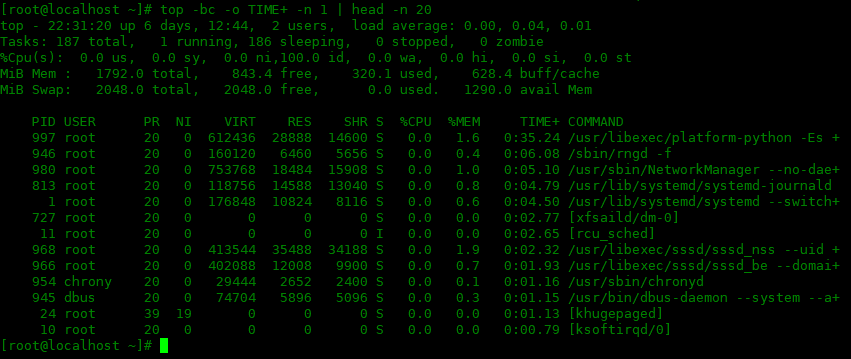
In batch mode, use the top command to arrange the data according to the usage time of the process. It shows the total amount of CPU time consumed by the process since it was started. Use the following command to view:
1 2 3 4 5 6 7 8 9 10 11 12 13 14 15 16 17 18 19 20 21 22 23 24 25 26 27 |
|
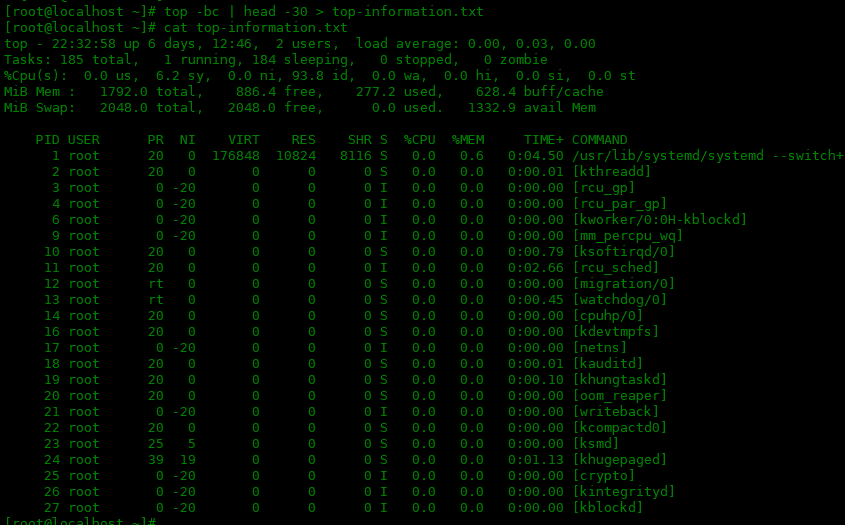
The output results of top can be saved to a file as follows:
1 |
|
Summarize
The top command is used to display real-time processing activities in a Linux system, as well as kernel-managed tasks. It will show CPU and memory usage and other information such as running programs. You can take advantage of script mode options to transfer top command output to other applications or files.
Through the introduction of this article, we can see that using the top command in batch mode in Linux systems can monitor system resources more efficiently and avoid the burden of interactive interfaces. We can switch to batch mode by setting the -b parameter of the top command. We can also use other parameters to customize the output results, set the refresh interval, etc. We believe that in this way, we can monitor and adjust the system more easily and efficiently, and improve the operating efficiency of the system.
The above is the detailed content of Efficient and easy, a powerful tool for system monitoring in Linux batch mode. For more information, please follow other related articles on the PHP Chinese website!

Hot AI Tools

Undresser.AI Undress
AI-powered app for creating realistic nude photos

AI Clothes Remover
Online AI tool for removing clothes from photos.

Undress AI Tool
Undress images for free

Clothoff.io
AI clothes remover

AI Hentai Generator
Generate AI Hentai for free.
Hot Article
Hot Tools

Notepad++7.3.1
Easy-to-use and free code editor

SublimeText3 Chinese version
Chinese version, very easy to use

Zend Studio 13.0.1
Powerful PHP integrated development environment

Dreamweaver CS6
Visual web development tools

SublimeText3 Mac version
God-level code editing software (SublimeText3)
Hot Topics
 1359
1359
 52
52

 deepseek web version entrance deepseek official website entrance
Feb 19, 2025 pm 04:54 PM
deepseek web version entrance deepseek official website entrance
Feb 19, 2025 pm 04:54 PM
DeepSeek is a powerful intelligent search and analysis tool that provides two access methods: web version and official website. The web version is convenient and efficient, and can be used without installation; the official website provides comprehensive product information, download resources and support services. Whether individuals or corporate users, they can easily obtain and analyze massive data through DeepSeek to improve work efficiency, assist decision-making and promote innovation.
 How to install deepseek
Feb 19, 2025 pm 05:48 PM
How to install deepseek
Feb 19, 2025 pm 05:48 PM
There are many ways to install DeepSeek, including: compile from source (for experienced developers) using precompiled packages (for Windows users) using Docker containers (for most convenient, no need to worry about compatibility) No matter which method you choose, Please read the official documents carefully and prepare them fully to avoid unnecessary trouble.
 Get the gate.io installation package for free
Feb 21, 2025 pm 08:21 PM
Get the gate.io installation package for free
Feb 21, 2025 pm 08:21 PM
Gate.io is a popular cryptocurrency exchange that users can use by downloading its installation package and installing it on their devices. The steps to obtain the installation package are as follows: Visit the official website of Gate.io, click "Download", select the corresponding operating system (Windows, Mac or Linux), and download the installation package to your computer. It is recommended to temporarily disable antivirus software or firewall during installation to ensure smooth installation. After completion, the user needs to create a Gate.io account to start using it.
 How to solve the permissions problem encountered when viewing Python version in Linux terminal?
Apr 01, 2025 pm 05:09 PM
How to solve the permissions problem encountered when viewing Python version in Linux terminal?
Apr 01, 2025 pm 05:09 PM
Solution to permission issues when viewing Python version in Linux terminal When you try to view Python version in Linux terminal, enter python...
 BITGet official website installation (2025 beginner's guide)
Feb 21, 2025 pm 08:42 PM
BITGet official website installation (2025 beginner's guide)
Feb 21, 2025 pm 08:42 PM
BITGet is a cryptocurrency exchange that provides a variety of trading services including spot trading, contract trading and derivatives. Founded in 2018, the exchange is headquartered in Singapore and is committed to providing users with a safe and reliable trading platform. BITGet offers a variety of trading pairs, including BTC/USDT, ETH/USDT and XRP/USDT. Additionally, the exchange has a reputation for security and liquidity and offers a variety of features such as premium order types, leveraged trading and 24/7 customer support.
 Ouyi okx installation package is directly included
Feb 21, 2025 pm 08:00 PM
Ouyi okx installation package is directly included
Feb 21, 2025 pm 08:00 PM
Ouyi OKX, the world's leading digital asset exchange, has now launched an official installation package to provide a safe and convenient trading experience. The OKX installation package of Ouyi does not need to be accessed through a browser. It can directly install independent applications on the device, creating a stable and efficient trading platform for users. The installation process is simple and easy to understand. Users only need to download the latest version of the installation package and follow the prompts to complete the installation step by step.
 Ouyi Exchange Download Official Portal
Feb 21, 2025 pm 07:51 PM
Ouyi Exchange Download Official Portal
Feb 21, 2025 pm 07:51 PM
Ouyi, also known as OKX, is a world-leading cryptocurrency trading platform. The article provides a download portal for Ouyi's official installation package, which facilitates users to install Ouyi client on different devices. This installation package supports Windows, Mac, Android and iOS systems. Users can choose the corresponding version to download according to their device type. After the installation is completed, users can register or log in to the Ouyi account, start trading cryptocurrencies and enjoy other services provided by the platform.
 How to automatically set permissions of unixsocket after system restart?
Mar 31, 2025 pm 11:54 PM
How to automatically set permissions of unixsocket after system restart?
Mar 31, 2025 pm 11:54 PM
How to automatically set the permissions of unixsocket after the system restarts. Every time the system restarts, we need to execute the following command to modify the permissions of unixsocket: sudo...
