

How to use vmstat command under Linux

vmstat is the abbreviation of virtual memory statistics. It is a very useful monitoring tool under Linux. In addition to memory, it also provides additional information such as block IO and CPU time
grammar
The execution of the vmstat command does not require special permissions and can be executed by ordinary users. Its syntax is as follows
vmstat [options] [delay [count]]
delay Indicates the data update interval, in seconds. If this value is not specified, it indicates the average time since the system started, and the result is only output once at this time
count represents the number of output times. If this value is not specified, but the value of delay is specified, it means unlimited times
Result field description
Enter vmstat on the command line and press Enter, the result will be output once
[root@cghost22 ~]# vmstat
procs -----------memory---------- ---swap-- -----io---- -system-- ------cpu-----
 r  b   swpd   free   buff  cache   si   so    bi    bo   in   cs us sy id wa st
 3  0      0 991324    932 537336    0    0     0     0    3    4  0  0 100  0  0
[root@cghost22 ~]#
There are many fields in the results. The following table lists the detailed description of each field
| Field | illustrate |
|---|---|
| #r | The number of runnable processes, including running and ready states |
| b | Number of processes in uninterruptible sleep state |
| swpd | Virtual memory usage |
| free | Free memory |
| buff | Amount of memory used as buffer |
| cache | Amount of memory used as cache |
| si | The amount of memory swapped from disk |
| so | Amount swapped out from memory to disk |
| bi | Blocks received from block device, unit: blocks/second |
| bo | Blocks sent to block device, unit: blocks/second |
| in | Number of interrupts per second, including clock interrupts |
| cs | Context switches per second |
| us | User mode execution time |
| sy | Kernel mode execution time |
| id | CPU idle time |
| wa | Waiting time for IO |
| st | Time stolen from the virtual machine |
The second row in the tableThe number of processes in the uninterruptible sleep state, the uninterruptible here refers to the state that a process enters when executing certain system calls. In this state , the process is blocked and cannot be interrupted until the system call is completed
The field results are divided into several parts according to color, from top to bottom: process information, memory information, IO information, system interrupt and context, CPU time
The default unit of the value in the memory information is KB (1024 kbytes). The CPU time field does not represent a specific time, but a percentage of the total CPU time
Common options
| Options | illustrate |
|---|---|
| -a | Show active and inactive memory |
| -f | The number of forks since system startup, including system calls such as fork, vfork and clone |
| -s | Display system event counts and memory statistics |
| -d | Report disk statistics |
| -D | Statistical active disk information |
| -p | Details of the specified partition |
| -t | Append a column of time display |
| -S | Display according to the specified byte unit |
| -w | The results are displayed in wide mode |
| -V | vmstat version |
常见用法
vmstat 命令主要用于识别系统的瓶颈,统计数据的时候,它不会包含自身进程
- 按照指定时间间隔和次数输出
[root@cghost22 ~]$ vmstat 2 10
procs -----------memory---------- ---swap-- -----io---- -system-- ------cpu-----
 r  b   swpd   free   buff  cache   si   so    bi    bo   in   cs us sy id wa st
 2  0  12552 148356 234324 3382956    0    0     1    21    4    4  2  2 97  0  0
 1  0  12552 148264 234324 3382980    0    0     0     0 14974 27478  3  2 96  0  0
 1  0  12552 148232 234324 3382984    0    0     0    14 14384 27181  3  2 96  0  0
 0  0  12552 148376 234332 3383052    0    0     0   204 14197 26812  4  2 94  0  0
 0  0  12552 148512 234332 3383088    0    0     0     4 14398 27155  3  2 95  0  0
 0  0  12552 147892 234332 3383128    0    0     0   210 15515 28802  3  2 95  0  0
 1  0  12552 148388 234332 3383156    0    0     0     0 15147 28042  3  2 95  0  0
 0  0  12552 148264 234332 3383168    0    0     0     4 14380 27395  3  1 96  0  0
 0  0  12552 148264 234336 3383216    0    0     0   198 14430 27008  3  1 95  0  0
 2  0  12552 148140 234336 3383252    0    0     0     6 14233 27161  3  2 95  0  0
2 表示每隔 2 秒输出一次结果,10 表示总共输出 10 次,10 次之后程序自动结束
- 修改内存显示单位
输出的结果中,内存数据的单位默认是 KB,可以通过 -S 选项调整显示的单位,有下面几种单位可供选择
注意:-S 选项对 si、 so 字段无效
k    # 1000 bytes
K    # 1024 bytes
m    # 1000 * 1000 bytes
M    # 1024 * 1024 bytes
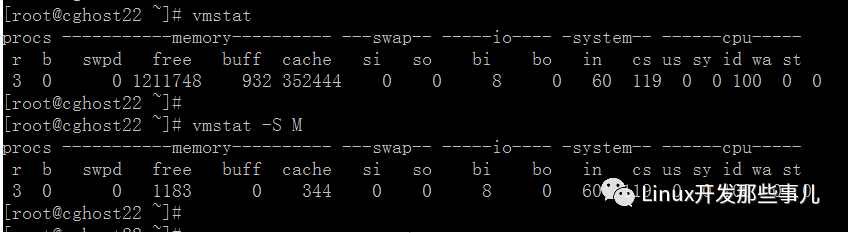
上图中第一个结果中内存数据显示单位是 KB , 第二个结果中单位是 MB,将第一个结果对应字段的数值除以 1024 就得到了第二个结果
- 活跃内存和非活跃内存
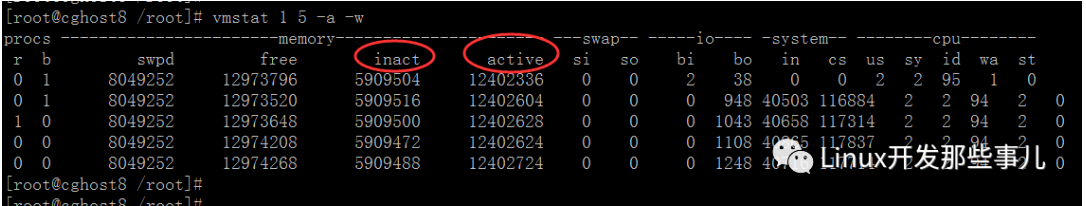
inact 是非活跃内存,active 是活跃内存
活跃内存是进程在使用的内存,非活跃内存是未运行进程的内存
- 系统启动以来 fork 的数量
这里的 fork 数量包括 fork、vfork 以及 clone 等系统调用
[root@cghost22 ~]# vmstat -f
        12714 forks
[root@cghost22 ~]# vmstat -f
        12715 forks
[root@cghost22 ~]# vmstat -f
        12716 forks
我们每次在控制台执行一次命令,系统就会 fork 一个新的进程来执行命令,比如像上面的例子,每执行一次 vmstat -f 命令,系统就会 fork 一个新进程
这个选项还可以用于统计某个操作消耗多少次 fork 调用,只需要在操作前后各执行一次 vmstat -f 命令,比较两次结果的差值即可
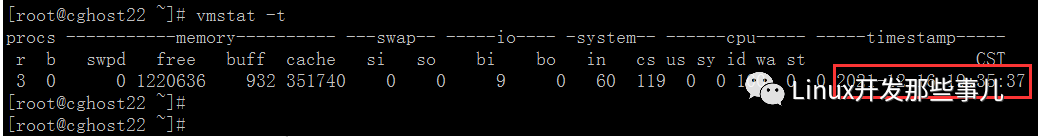
- 每行追加一列时间
追加一列时间显示,有助于比较一段时间内的结果
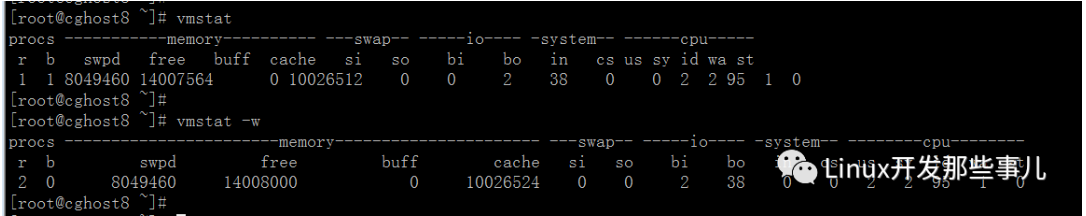
- 按照宽模式显示
vmstat 结果中的某些字段的数字有时会比较长,而且跟字段名的位置有偏差, 不太适合人类的观看习惯,-w 选项可以按照宽模式显示数据,使结果看起来更直观,下图是分别未使用宽模式和使用了宽模式的一个对比
- 统计磁盘信息
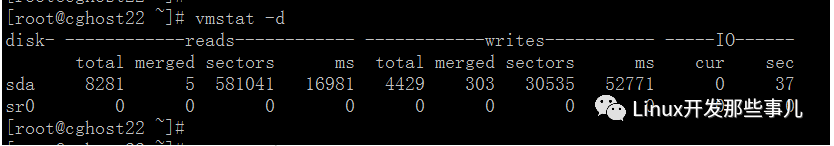
磁盘信息主要分三个方面:读、写、IO ,读和写以毫秒为单位,IO以秒为单位
读
    total:     成功读取的总数
    merged:    分组读取(产生一个 IO)
    sectors:   成功读取的扇区数
    ms:        读取花费的毫秒

写
    total:      成功写入的总数
    merged:     分组写入(产生一个 IO)
    sectors:    成功写入的扇区数
    ms:         写花费的毫秒

IO
    cur:    正在进行的IO
    s:      IO花费的秒数
- 指定磁盘分区信息
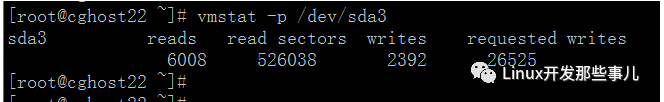
上图中,输出结果显示 sda3 分区设备的信息,它们包括:读计数、读取的扇区数,写计数,分区写请求总数
The above is the detailed content of How to use vmstat command under Linux. For more information, please follow other related articles on the PHP Chinese website!

Hot AI Tools

Undresser.AI Undress
AI-powered app for creating realistic nude photos

AI Clothes Remover
Online AI tool for removing clothes from photos.

Undress AI Tool
Undress images for free

Clothoff.io
AI clothes remover

Video Face Swap
Swap faces in any video effortlessly with our completely free AI face swap tool!

Hot Article
Hot Tools

Notepad++7.3.1
Easy-to-use and free code editor

SublimeText3 Chinese version
Chinese version, very easy to use

Zend Studio 13.0.1
Powerful PHP integrated development environment

Dreamweaver CS6
Visual web development tools

SublimeText3 Mac version
God-level code editing software (SublimeText3)
Hot Topics
 1386
1386
 52
52

 How to use docker desktop
Apr 15, 2025 am 11:45 AM
How to use docker desktop
Apr 15, 2025 am 11:45 AM
How to use Docker Desktop? Docker Desktop is a tool for running Docker containers on local machines. The steps to use include: 1. Install Docker Desktop; 2. Start Docker Desktop; 3. Create Docker image (using Dockerfile); 4. Build Docker image (using docker build); 5. Run Docker container (using docker run).
 Difference between centos and ubuntu
Apr 14, 2025 pm 09:09 PM
Difference between centos and ubuntu
Apr 14, 2025 pm 09:09 PM
The key differences between CentOS and Ubuntu are: origin (CentOS originates from Red Hat, for enterprises; Ubuntu originates from Debian, for individuals), package management (CentOS uses yum, focusing on stability; Ubuntu uses apt, for high update frequency), support cycle (CentOS provides 10 years of support, Ubuntu provides 5 years of LTS support), community support (CentOS focuses on stability, Ubuntu provides a wide range of tutorials and documents), uses (CentOS is biased towards servers, Ubuntu is suitable for servers and desktops), other differences include installation simplicity (CentOS is thin)
 What to do if the docker image fails
Apr 15, 2025 am 11:21 AM
What to do if the docker image fails
Apr 15, 2025 am 11:21 AM
Troubleshooting steps for failed Docker image build: Check Dockerfile syntax and dependency version. Check if the build context contains the required source code and dependencies. View the build log for error details. Use the --target option to build a hierarchical phase to identify failure points. Make sure to use the latest version of Docker engine. Build the image with --t [image-name]:debug mode to debug the problem. Check disk space and make sure it is sufficient. Disable SELinux to prevent interference with the build process. Ask community platforms for help, provide Dockerfiles and build log descriptions for more specific suggestions.
 How to view the docker process
Apr 15, 2025 am 11:48 AM
How to view the docker process
Apr 15, 2025 am 11:48 AM
Docker process viewing method: 1. Docker CLI command: docker ps; 2. Systemd CLI command: systemctl status docker; 3. Docker Compose CLI command: docker-compose ps; 4. Process Explorer (Windows); 5. /proc directory (Linux).
 Detailed explanation of docker principle
Apr 14, 2025 pm 11:57 PM
Detailed explanation of docker principle
Apr 14, 2025 pm 11:57 PM
Docker uses Linux kernel features to provide an efficient and isolated application running environment. Its working principle is as follows: 1. The mirror is used as a read-only template, which contains everything you need to run the application; 2. The Union File System (UnionFS) stacks multiple file systems, only storing the differences, saving space and speeding up; 3. The daemon manages the mirrors and containers, and the client uses them for interaction; 4. Namespaces and cgroups implement container isolation and resource limitations; 5. Multiple network modes support container interconnection. Only by understanding these core concepts can you better utilize Docker.
 What computer configuration is required for vscode
Apr 15, 2025 pm 09:48 PM
What computer configuration is required for vscode
Apr 15, 2025 pm 09:48 PM
VS Code system requirements: Operating system: Windows 10 and above, macOS 10.12 and above, Linux distribution processor: minimum 1.6 GHz, recommended 2.0 GHz and above memory: minimum 512 MB, recommended 4 GB and above storage space: minimum 250 MB, recommended 1 GB and above other requirements: stable network connection, Xorg/Wayland (Linux)
 How to switch Chinese mode with vscode
Apr 15, 2025 pm 11:39 PM
How to switch Chinese mode with vscode
Apr 15, 2025 pm 11:39 PM
VS Code To switch Chinese mode: Open the settings interface (Windows/Linux: Ctrl, macOS: Cmd,) Search for "Editor: Language" settings Select "Chinese" in the drop-down menu Save settings and restart VS Code
 What is vscode What is vscode for?
Apr 15, 2025 pm 06:45 PM
What is vscode What is vscode for?
Apr 15, 2025 pm 06:45 PM
VS Code is the full name Visual Studio Code, which is a free and open source cross-platform code editor and development environment developed by Microsoft. It supports a wide range of programming languages and provides syntax highlighting, code automatic completion, code snippets and smart prompts to improve development efficiency. Through a rich extension ecosystem, users can add extensions to specific needs and languages, such as debuggers, code formatting tools, and Git integrations. VS Code also includes an intuitive debugger that helps quickly find and resolve bugs in your code.
