How is CPU utilization calculated in Linux?
When observing the running status of online services on an online server, most people like to use the top command first to see the overall CPU utilization of the current system. For example, for a random machine, the utilization information displayed by the top command is as follows:

This output result is simple to say the least, but not so easy to understand if it is complex. For example:
Question 1: How is the utilization information output by top calculated? Is it accurate?
Question 2: The ni column is nice. It outputs the CPU overhead when processing?
Question 3: wa represents io wait, so is the CPU busy or idle during this period?
Today we have an in-depth study of cpu utilization statistics. Through today's study, you will not only understand the implementation details of CPU utilization statistics, but also have a deeper understanding of indicators such as nice and io wait.
Today we start with our own thoughts!
1. Think about it first
Leaving aside the implementation of Linux, if you have the following requirements, there is a quad-core server with four processes running on it.
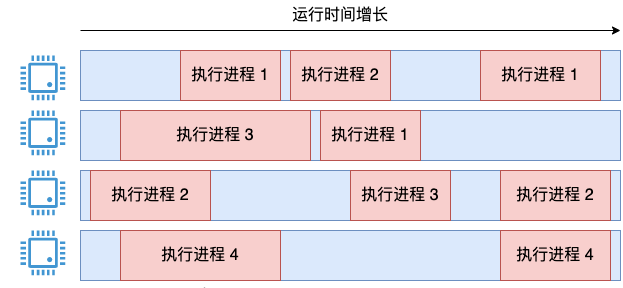
Allows you to design and calculate the CPU utilization of the entire system. It supports output like the top command and meets the following requirements:
- The cpu usage rate should be as accurate as possible;
- It is necessary to reflect the instantaneous CPU status at the second level as much as possible.
You can stop and think for a few minutes.

Okay, end of thinking. After thinking about it, you will find that this seemingly simple requirement is actually a bit complicated.
One idea is to add up the execution time of all processes and then divide it by the total system execution time * 4.
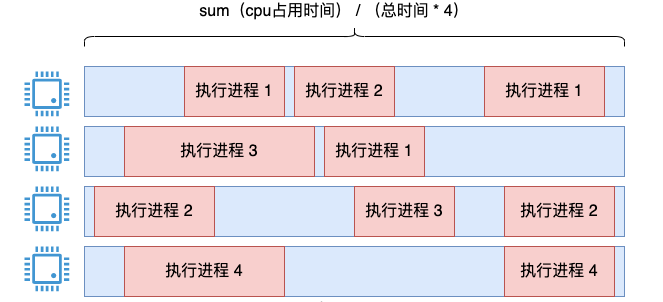
There is no problem with this idea. It is possible to use this method to count CPU utilization over a long period of time, and the statistics are accurate enough.
But as long as you have used top, you will know that the cpu utilization output by top is not constant for a long time, but will be dynamically updated in units of 3 seconds by default (this time interval can be set using -d). Our solution can reflect the total utilization, but it is difficult to reflect this instantaneous state. You may think that I can count it as one every 3 seconds, right? But at what point does this 3-second period begin. The granularity is difficult to control.
The core of the previous thinking question is how to solve instantaneous problems. When it comes to the transient state, you may have another idea. Then I will use instant sampling to see how many cores are currently busy. If two of the four cores are busy, the utilization is 50%.
This line of thinking is also correct, but there are two problems:
- The numbers you calculate are all multiples of 25%;
- This instantaneous value can cause wild swings in the CPU usage display.
For example, the picture below:
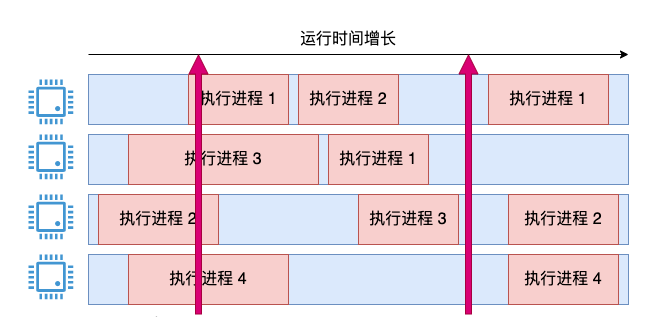
From the instantaneous state of t1, the system's CPU utilization is undoubtedly 100%, but from the perspective of t2, the usage has become 0%. The idea is in the right direction, but obviously this crude calculation cannot work as elegantly as the top command.
Let’s improve it and combine the above two ideas, maybe we can solve our problem. In terms of sampling, we set the period to be finer, but in terms of calculation, we set the period to be coarser.
We introduce the concept of adoption period, timing, such as sampling every 1 millisecond. If the CPU is running at the moment of sampling, this 1 ms is recorded as used. At this time, an instantaneous CPU usage will be obtained and saved.
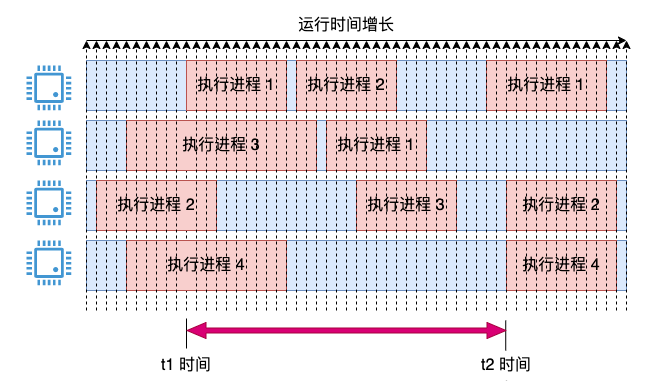
When counting the CPU usage within 3 seconds, such as the t1 and t2 time range in the above figure. Then add all the instantaneous values during this period and take an average. This can solve the above problem, the statistics are relatively accurate, and the problem of instantaneous values oscillating violently and being too coarse-grained (can only change in units of 25%) is avoided.
Some students may ask, what if the CPU changes between two samplings, as shown in the picture below.
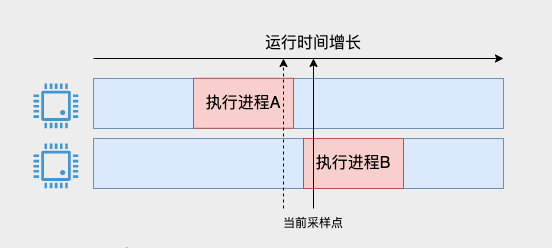
When the current sampling point arrives, process A has just finished executing. For a little while, it has not been counted by the previous sampling point, nor can it be counted this time. For process B, it actually only started for a short period of time. It seems a bit too much to record all 1 ms.
This problem does exist, but because our sampling is once every 1 ms, and when we actually check and use it, it is at least on the second level, which will include information from thousands of sampling points, so this error It will not affect our grasp of the overall situation.
In fact, this is how Linux counts system CPU utilization. Although there may be errors, it is enough to be used as a statistical data. In terms of implementation, Linux accumulates all instantaneous values into a certain data, rather than actually storing many copies of instantaneous data.
Next, let us enter Linux to see its specific implementation of system cpu utilization statistics.
2. Where is the data used by the top command
The implementation of Linux we mentioned in the previous section is to accumulate instantaneous values to a certain data. This value is exposed to the user mode by the kernel through the /proc/stat pseudo file. Linux uses it when calculating system CPU utilization.
Overall, the internal details of the top command work are shown in the figure below.
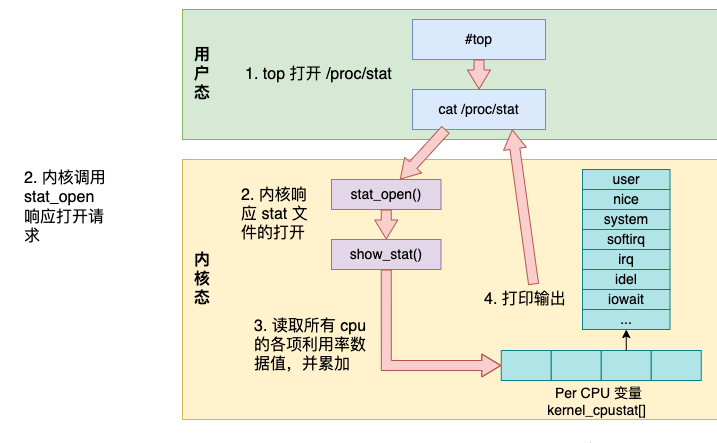
The top command accesses /proc/stat to obtain various cpu utilization values;
-
The kernel calls the stat_open function to handle access to /proc/stat;
-
The data accessed by the kernel comes from the kernel_cpustat array and is summarized;
-
Print output to user mode.
Next, let’s take a look at each step in detail.
By using strace to trace the various system calls of the top command, you can see its calls to the file.
# strace top
...
openat(AT_FDCWD, "/proc/stat", O_RDONLY) = 4
openat(AT_FDCWD, "/proc/2351514/stat", O_RDONLY) = 8
openat(AT_FDCWD, "/proc/2393539/stat", O_RDONLY) = 8
...
“
In addition to /proc/stat, there is also /proc/{pid}/stat broken down by each process, which is used to calculate the cpu utilization of each process.
”
The kernel defines processing functions for each pseudo-file. The processing method of /proc/stat file is proc_stat_operations.
//file:fs/proc/stat.c
static int __init proc_stat_init(void)
{
 proc_create("stat", 0, NULL, &proc_stat_operations);
 return 0;
}

static const struct file_operations proc_stat_operations = {
 .open  = stat_open,
 ...
};
proc_stat_operations contains the operation methods corresponding to this file. When the /proc/stat file is opened, stat_open will be called. stat_open calls single_open_size and show_stat in sequence to output the data content. Let’s take a look at its code:
//file:fs/proc/stat.c
static int show_stat(struct seq_file *p, void *v)
{
 u64 user, nice, system, idle, iowait, irq, softirq, steal;

 for_each_possible_cpu(i) {
  struct kernel_cpustat *kcs = &kcpustat_cpu(i);

  user += kcs->cpustat[CPUTIME_USER];
  nice += kcs->cpustat[CPUTIME_NICE];
  system += kcs->cpustat[CPUTIME_SYSTEM];
  idle += get_idle_time(kcs, i);
  iowait += get_iowait_time(kcs, i);
  irq += kcs->cpustat[CPUTIME_IRQ];
  softirq += kcs->cpustat[CPUTIME_SOFTIRQ];
  ...
 }

 //转换成节拍数并打印出来
 seq_put_decimal_ull(p, "cpu  ", nsec_to_clock_t(user));
 seq_put_decimal_ull(p, " ", nsec_to_clock_t(nice));
 seq_put_decimal_ull(p, " ", nsec_to_clock_t(system));
 seq_put_decimal_ull(p, " ", nsec_to_clock_t(idle));
 seq_put_decimal_ull(p, " ", nsec_to_clock_t(iowait));
 seq_put_decimal_ull(p, " ", nsec_to_clock_t(irq));
 seq_put_decimal_ull(p, " ", nsec_to_clock_t(softirq));
 ...
}
In the above code, for_each_possible_cpu is traversing the kcpustat_cpu variable that stores cpu usage data. This variable is a percpu variable, which prepares an array element for each logical core. It stores various events corresponding to the current core, including user, nice, system, idel, iowait, irq, softirq, etc.
In this loop, add up each usage of each core. Finally, the data is output through seq_put_decimal_ull.
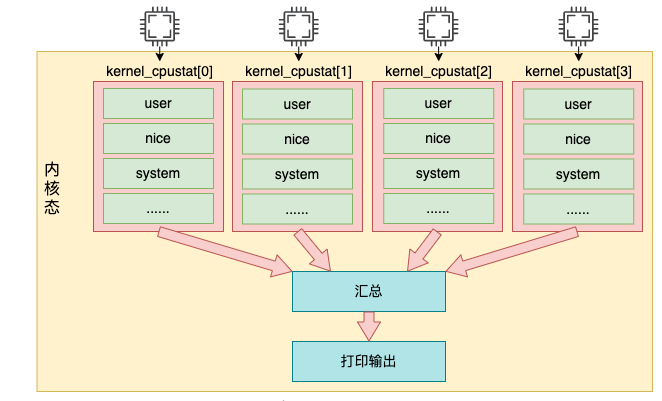
Note that in the kernel, each time is actually recorded in nanoseconds, but they are all converted into beat units when output. As for the length of the beat unit, we will introduce it in the next section. In short, the output of /proc/stat is read from the percpu variable kernel_cpustat.
Let’s take a look at when the data in this variable was added.
三、统计数据怎么来的
前面我们提到内核是以采样的方式来统计 cpu 使用率的。这个采样周期依赖的是 Linux 时间子系统中的定时器。
Linux 内核每隔固定周期会发出 timer interrupt (IRQ 0),这有点像乐谱中的节拍的概念。每隔一段时间,就打出一个拍子,Linux 就响应之并处理一些事情。

一个节拍的长度是多长时间,是通过 CONFIG_HZ 来定义的。它定义的方式是每一秒有几次 timer interrupts。不同的系统中这个节拍的大小可能不同,通常在 1 ms 到 10 ms 之间。可以在自己的 Linux config 文件中找到它的配置。
# grep ^CONFIG_HZ /boot/config-5.4.56.bsk.10-amd64
CONFIG_HZ=1000
从上述结果中可以看出,我的机器每秒要打出 1000 次节拍。也就是每 1 ms 一次。
每次当时间中断到来的时候,都会调用 update_process_times 来更新系统时间。更新后的时间都存储在我们前面提到的 percpu 变量 kcpustat_cpu 中。
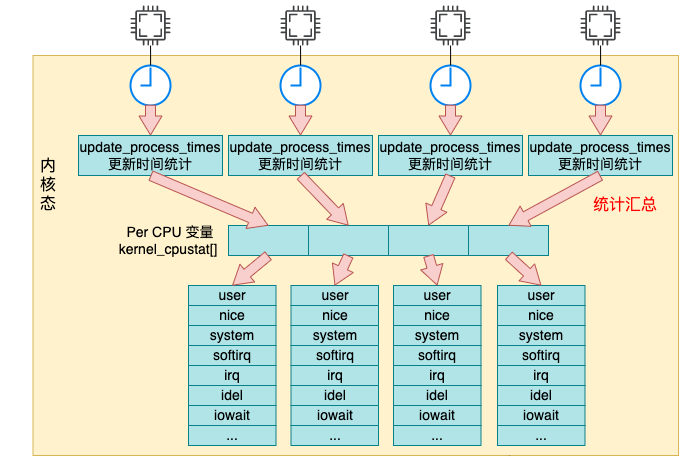
我们来详细看下汇总过程 update_process_times 的源码,它位于 kernel/time/timer.c 文件中。
//file:kernel/time/timer.c
void update_process_times(int user_tick)
{
 struct task_struct *p = current;

 //进行时间累积处理
 account_process_tick(p, user_tick);
 ...
}
这个函数的参数 user_tick 指的是采样的瞬间是处于内核态还是用户态。接下来调用 account_process_tick。
//file:kernel/sched/cputime.c
void account_process_tick(struct task_struct *p, int user_tick)
{
 cputime = TICK_NSEC;
 ...

 if (user_tick)
  //3.1 统计用户态时间
  account_user_time(p, cputime);
 else if ((p != rq->idle) || (irq_count() != HARDIRQ_OFFSET))
  //3.2 统计内核态时间
  account_system_time(p, HARDIRQ_OFFSET, cputime);
 else
  //3.3 统计空闲时间
  account_idle_time(cputime);
}
在这个函数中,首先设置 cputime = TICK_NSEC, 一个 TICK_NSEC 的定义是一个节拍所占的纳秒数。接下来根据判断结果分别执行 account_user_time、account_system_time 和 account_idle_time 来统计用户态、内核态和空闲时间。
3.1 用户态时间统计
//file:kernel/sched/cputime.c
void account_user_time(struct task_struct *p, u64 cputime)
{
 //分两种种情况统计用户态 CPU 的使用情况
 int index;
 index = (task_nice(p) > 0) ? CPUTIME_NICE : CPUTIME_USER;

 //将时间累积到 /proc/stat 中
 task_group_account_field(p, index, cputime);
 ......
}
account_user_time 函数主要分两种情况统计:
- 如果进程的 nice 值大于 0,那么将会增加到 CPU 统计结构的 nice 字段中。
- 如果进程的 nice 值小于等于 0,那么增加到 CPU 统计结构的 user 字段中。
看到这里,开篇的问题 2 就有答案了,其实用户态的时间不只是 user 字段,nice 也是。之所以要把 nice 分出来,是为了让 Linux 用户更一目了然地看到调过 nice 的进程所占的 cpu 周期有多少。
我们平时如果想要观察系统的用户态消耗的时间的话,应该是将 top 中输出的 user 和 nice 加起来一并考虑,而不是只看 user!
接着调用 task_group_account_field 来把时间加到前面我们用到的 kernel_cpustat 内核变量中。
//file:kernel/sched/cputime.c
static inline void task_group_account_field(struct task_struct *p, int index,
      u64 tmp)
{
 __this_cpu_add(kernel_cpustat.cpustat[index], tmp);
 ...
}
3.2 内核态时间统计
我们再来看内核态时间是如何统计的,找到 account_system_time 的代码。
//file:kernel/sched/cputime.c
void account_system_time(struct task_struct *p, int hardirq_offset, u64 cputime)
{
 if (hardirq_count() - hardirq_offset)
  index = CPUTIME_IRQ;
 else if (in_serving_softirq())
  index = CPUTIME_SOFTIRQ;
 else
  index = CPUTIME_SYSTEM;

 account_system_index_time(p, cputime, index);
}
内核态的时间主要分 3 种情况进行统计。
- 如果当前处于硬中断执行上下文, 那么统计到 irq 字段中;
- 如果当前处于软中断执行上下文, 那么统计到 softirq 字段中;
- 否则统计到 system 字段中。
判断好要加到哪个统计项中后,依次调用 account_system_index_time、task_group_account_field 来将这段时间加到内核变量 kernel_cpustat 中。
//file:kernel/sched/cputime.c
static inline void task_group_account_field(struct task_struct *p, int index,
      u64 tmp)
{
 __this_cpu_add(kernel_cpustat.cpustat[index], tmp);
}
3.3 空闲时间的累积
没错,在内核变量 kernel_cpustat 中不仅仅是统计了各种用户态、内核态的使用时间,空闲也一并统计起来了。
如果在采样的瞬间,cpu 既不在内核态也不在用户态的话,就将当前节拍的时间都累加到 idle 中。
//file:kernel/sched/cputime.c
void account_idle_time(u64 cputime)
{
 u64 *cpustat = kcpustat_this_cpu->cpustat;
 struct rq *rq = this_rq();

 if (atomic_read(&rq->nr_iowait) > 0)
  cpustat[CPUTIME_IOWAIT] += cputime;
 else
  cpustat[CPUTIME_IDLE] += cputime;
}
在 cpu 空闲的情况下,进一步判断当前是不是在等待 IO(例如磁盘 IO),如果是的话这段空闲时间会加到 iowait 中,否则就加到 idle 中。从这里,我们可以看到 iowait 其实是 cpu 的空闲时间,只不过是在等待 IO 完成而已。
看到这里,开篇问题 3 也有非常明确的答案了,io wait 其实是 cpu 在空闲状态的一项统计,只不过这种状态和 idle 的区别是 cpu 是因为等待 io 而空闲。
四、总结
本文深入分析了 Linux 统计系统 CPU 利用率的内部原理。全文的内容可以用如下一张图来汇总:
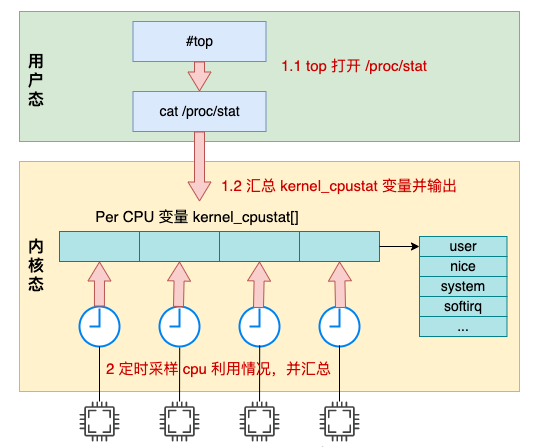
Linux 中的定时器会以某个固定节拍,比如 1 ms 一次采样各个 cpu 核的使用情况,然后将当前节拍的所有时间都累加到 user/nice/system/irq/softirq/io_wait/idle 中的某一项上。
top 命令是读取的 /proc/stat 中输出的 cpu 各项利用率数据,而这个数据在内核中是根据 kernel_cpustat 来汇总并输出的。
回到开篇问题 1,top 输出的利用率信息是如何计算出来的,它精确吗?
/proc/stat 文件输出的是某个时间点的各个指标所占用的节拍数。如果想像 top 那样输出一个百分比,计算过程是分两个时间点 t1, t2 分别获取一下 stat 文件中的相关输出,然后经过个简单的算术运算便可以算出当前的 cpu 利用率。
再说是否精确。这个统计方法是采样的,只要是采样,肯定就不是百分之百精确。但由于我们查看 cpu 使用率的时候往往都是计算 1 秒甚至更长一段时间的使用情况,这其中会包含很多采样点,所以查看整体情况是问题不大的。
另外从本文,我们也学到了 top 中输出的 cpu 时间项目其实大致可以分为三类:
第****一类:用户态消耗时间,包括 user 和 nice。如果想看用户态的消耗,要将 user 和 nice 加起来看才对。
第二类:内核态消耗时间,包括 irq、softirq 和 system。
第三类:空闲时间,包括 io_wait 和 idle。其中 io_wait 也是 cpu 的空闲状态,只不过是在等 io 完成而已。如果只是想看 cpu 到底有多闲,应该把 io_wait 和 idle 加起来才对。
The above is the detailed content of How is CPU utilization calculated in Linux?. For more information, please follow other related articles on the PHP Chinese website!

Hot AI Tools

Undresser.AI Undress
AI-powered app for creating realistic nude photos

AI Clothes Remover
Online AI tool for removing clothes from photos.

Undress AI Tool
Undress images for free

Clothoff.io
AI clothes remover

Video Face Swap
Swap faces in any video effortlessly with our completely free AI face swap tool!

Hot Article

Hot Tools

Notepad++7.3.1
Easy-to-use and free code editor

SublimeText3 Chinese version
Chinese version, very easy to use

Zend Studio 13.0.1
Powerful PHP integrated development environment

Dreamweaver CS6
Visual web development tools

SublimeText3 Mac version
God-level code editing software (SublimeText3)

Hot Topics
 1393
1393
 52
52
 1206
1206
 24
24
 What computer configuration is required for vscode
Apr 15, 2025 pm 09:48 PM
VS Code system requirements: Operating system: Windows 10 and above, macOS 10.12 and above, Linux distribution processor: minimum 1.6 GHz, recommended 2.0 GHz and above memory: minimum 512 MB, recommended 4 GB and above storage space: minimum 250 MB, recommended 1 GB and above other requirements: stable network connection, Xorg/Wayland (Linux)
 vscode cannot install extension
Apr 15, 2025 pm 07:18 PM
The reasons for the installation of VS Code extensions may be: network instability, insufficient permissions, system compatibility issues, VS Code version is too old, antivirus software or firewall interference. By checking network connections, permissions, log files, updating VS Code, disabling security software, and restarting VS Code or computers, you can gradually troubleshoot and resolve issues.
 Can vscode be used for mac
Apr 15, 2025 pm 07:36 PM
VS Code is available on Mac. It has powerful extensions, Git integration, terminal and debugger, and also offers a wealth of setup options. However, for particularly large projects or highly professional development, VS Code may have performance or functional limitations.
 What is vscode What is vscode for?
Apr 15, 2025 pm 06:45 PM
VS Code is the full name Visual Studio Code, which is a free and open source cross-platform code editor and development environment developed by Microsoft. It supports a wide range of programming languages and provides syntax highlighting, code automatic completion, code snippets and smart prompts to improve development efficiency. Through a rich extension ecosystem, users can add extensions to specific needs and languages, such as debuggers, code formatting tools, and Git integrations. VS Code also includes an intuitive debugger that helps quickly find and resolve bugs in your code.
 How to use VSCode
Apr 15, 2025 pm 11:21 PM
Visual Studio Code (VSCode) is a cross-platform, open source and free code editor developed by Microsoft. It is known for its lightweight, scalability and support for a wide range of programming languages. To install VSCode, please visit the official website to download and run the installer. When using VSCode, you can create new projects, edit code, debug code, navigate projects, expand VSCode, and manage settings. VSCode is available for Windows, macOS, and Linux, supports multiple programming languages and provides various extensions through Marketplace. Its advantages include lightweight, scalability, extensive language support, rich features and version
 How to run java code in notepad
Apr 16, 2025 pm 07:39 PM
Although Notepad cannot run Java code directly, it can be achieved by using other tools: using the command line compiler (javac) to generate a bytecode file (filename.class). Use the Java interpreter (java) to interpret bytecode, execute the code, and output the result.
 What is the main purpose of Linux?
Apr 16, 2025 am 12:19 AM
The main uses of Linux include: 1. Server operating system, 2. Embedded system, 3. Desktop operating system, 4. Development and testing environment. Linux excels in these areas, providing stability, security and efficient development tools.
 How to check the warehouse address of git
Apr 17, 2025 pm 01:54 PM
To view the Git repository address, perform the following steps: 1. Open the command line and navigate to the repository directory; 2. Run the "git remote -v" command; 3. View the repository name in the output and its corresponding address.


