

How to explore and visualize ML data for object detection in images

In recent years, people have gained a deeper understanding of the importance of in-depth understanding of machine learning data (ML-data). However, since detecting large data sets usually requires a lot of human and material investment, its widespread application in the field of computer vision still requires further development.
Usually, in object detection (Object Detection, which is a subset of computer vision), objects in the image are positioned by defining bounding boxes, which can not only identify objects, but also Understand an object's context, size, and relationship to other elements in the scene. At the same time, a comprehensive understanding of the distribution of classes, the diversity of object sizes, and the common environments in which classes appear will also help to discover error patterns in the training model during evaluation and debugging, so that additional training data can be selected more targeted .
In practice, I often take the following approach:
- Use the enhanced functions of pre-trained models or basic models, Add structure to your data. For example: creating various image embeddings and employing dimensionality reduction techniques such as t-SNE or UMAP. These can generate similarity maps to facilitate data browsing. In addition, using pre-trained models for detection can also facilitate context extraction.
- Use visualization tools that can integrate such structures with statistical and review capabilities of the raw data.
Below, I will introduce how to use Renomics Spotlight to create interactive object detection visualizations. As an example, I will try to:
- Build a visualization for a person detector in an image.
- Visualizations include similarity maps, filters, and statistics for easy exploration of the data.
- View every image through ground truth and Ultralytics YOLOv8 detection details.

Download the character images in the COCO dataset
First, install the required software packages through the following command:
!pip install fiftyone ultralytics renumics-spotlight
importpandasaspdimportnumpyasnpimportfiftyone.zooasfoz# 从 COCO 数据集中下载 1000 张带人的图像dataset = foz.load_zoo_dataset( "coco-2017"、split="validation"、label_types=[ "detections"、],classes=["person"]、 max_samples=1000、dataset_name="coco-2017-person-1k-validations"、)
Next, you can use the following code:
def xywh_too_xyxyn(bbox): "" convert from xywh to xyxyn format """ return[bbox[0], bbox[1], bbox[0] + bbox[2], bbox[1] + bbox[3]].行 = []fori, samplein enumerate(dataset):labels = [detection.labelfordetectioninsample.ground_truth.detections] bboxs = [...bboxs = [xywh_too_xyxyn(detection.bounding_box) fordetectioninsample.ground_truth.detections]bboxs_persons = [bboxforbbox, labelin zip(bboxs, labels)iflabel =="person"] 行。row.append([sample.filepath, labels, bboxs, bboxs_persons])df = pd.DataFrame(row, columns=["filepath","categories", "bboxs", "bboxs_persons"])df["major_category"] = df["categories"].apply( lambdax:max(set(x) -set(["person"]), key=x.count) if len(set(x)) >1 else "only person"。)
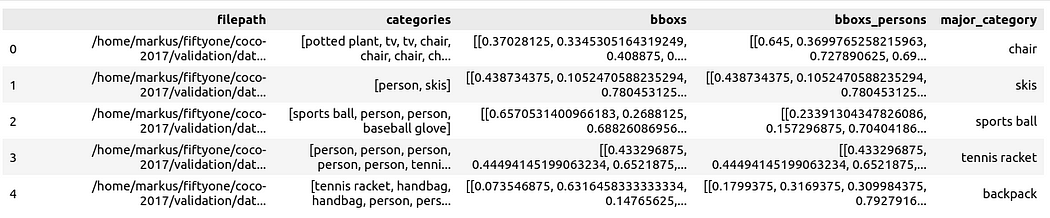
Prepare the data is a Pandas DataFrame with columns including: file path, bounding box category, bounding box, the person contained in the bounding box, and the main category (despite the person) to specify the context of the person in the image:
You can then visualize it via Spotlight:
From renumics import spotlightspotlight.show(df)
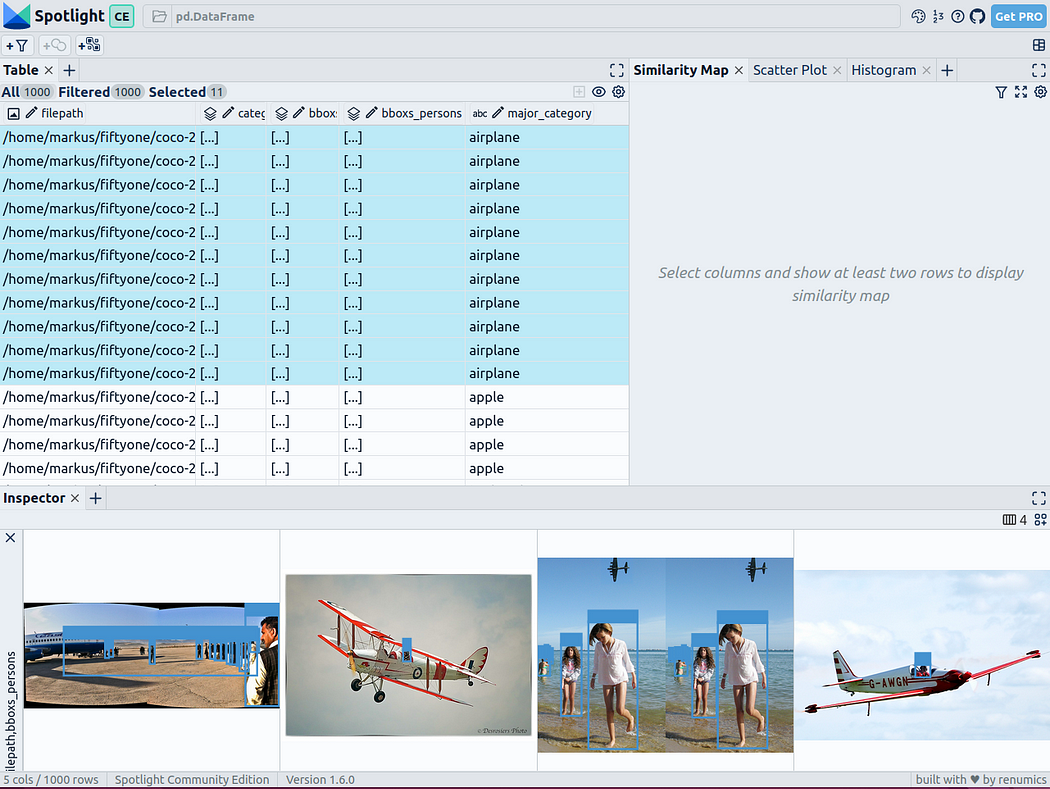
You can use Add View button in the inspector view and select bboxs_persons and filepath in the border view to display the corresponding border with the image:
Embed Rich data
To make the data structured, we can use image embedding of various basic models (ie: dense vector representation). To do this, you can use further dimensionality reduction techniques such as UMAP or t-SNE to apply Vision Transformer (ViT) embeddings of the entire image to the structuring of the dataset, thus providing a 2D similarity map of the image. Additionally, you can use the output of a pretrained object detector to structure your data by classifying it by the size or number of objects it contains. Since the COCO dataset already provides this information, we can use it directly.
Since Spotlight integrates support for the google/vit-base-patch16-224-in21k (ViT) model and UMAP , So when you create various embeds using file paths, it will be automatically applied:
spotlight.show(df, embed=["filepath"])
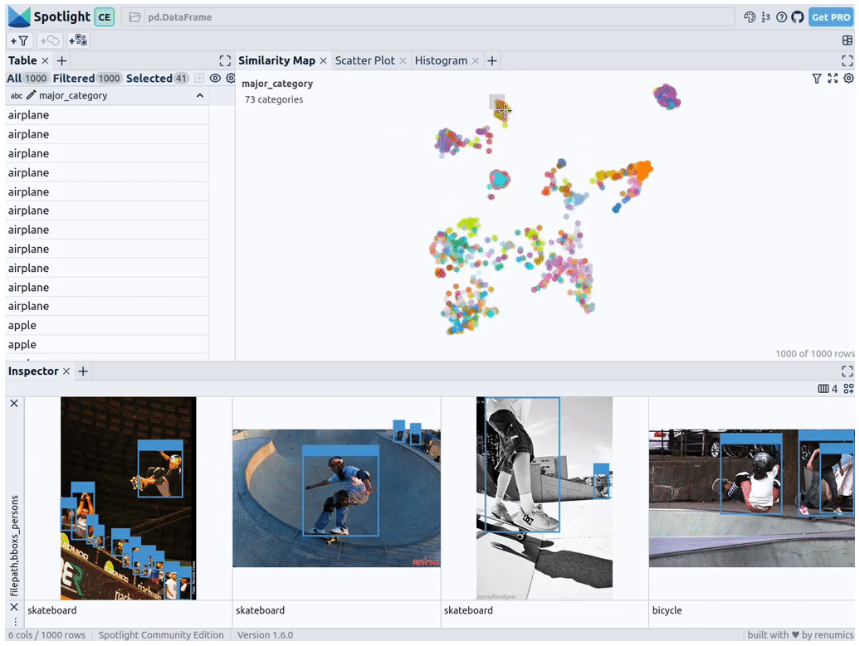
通过上述代码,Spotlight 将各种嵌入进行计算,并应用 UMAP 在相似性地图中显示结果。其中,不同的颜色代表了主要的类别。据此,您可以使用相似性地图来浏览数据:
预训练YOLOv8的结果
可用于快速识别物体的Ultralytics YOLOv8,是一套先进的物体检测模型。它专为快速图像处理而设计,适用于各种实时检测任务,特别是在被应用于大量数据时,用户无需浪费太多的等待时间。
为此,您可以首先加载预训练模型:
From ultralytics import YOLOdetection_model = YOLO("yolov8n.pt")并执行各种检测:
detections = []forfilepathindf["filepath"].tolist():detection = detection_model(filepath)[0]detections.append({ "yolo_bboxs":[np.array(box.xyxyn.tolist())[0]forboxindetection.boxes]、 "yolo_conf_persons": np.mean([np.array(box.conf.tolist())[0]. forboxindetection.boxes ifdetection.names[int(box.cls)] =="person"]), np.mean(]), "yolo_bboxs_persons":[np.array(box.xyxyn.tolist())[0] forboxindetection.boxes ifdetection.names[int(box.cls)] =="person],"yolo_categories": np.array([np.array(detection.names[int(box.cls)])forboxindetection.boxes], "yolo_categories": np.array(),})df_yolo = pd.DataFrame(detections)在12gb的GeForce RTX 4070 Ti上,上述过程在不到20秒的时间内便可完成。接着,您可以将结果包含在DataFrame中,并使用Spotlight将其可视化。请参考如下代码:
df_merged = pd.concat([df, df_yolo], axis=1)spotlight.show(df_merged, embed=["filepath"])
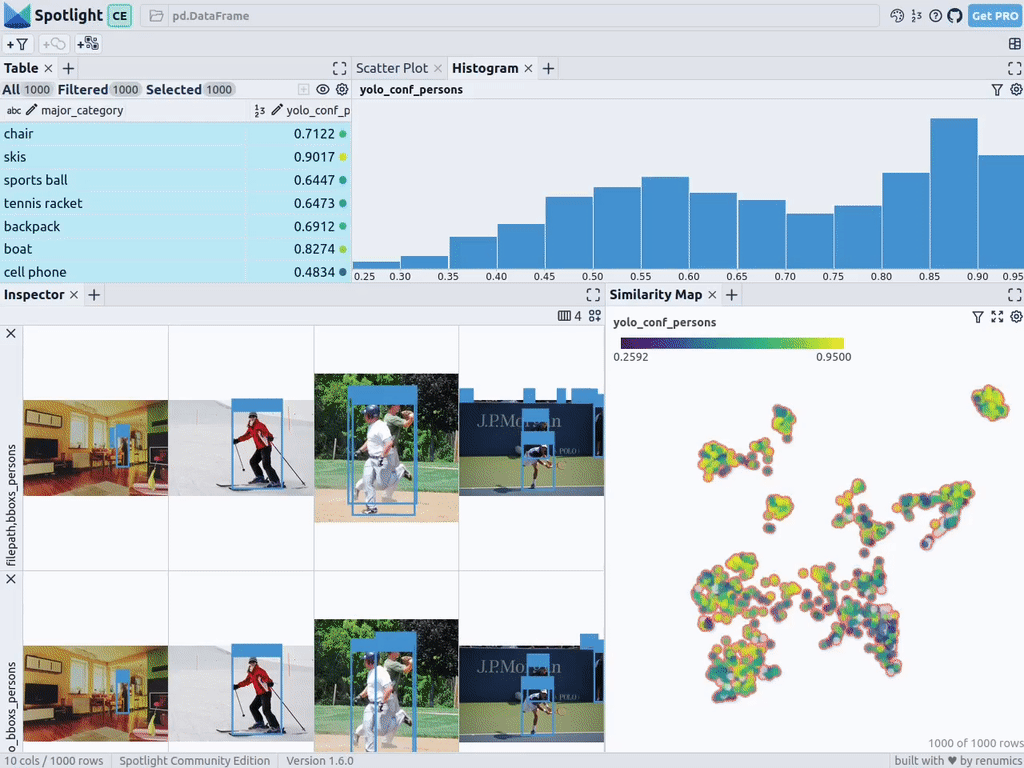
下一步,Spotlight将再次计算各种嵌入,并应用UMAP到相似度图中显示结果。不过这一次,您可以为检测到的对象选择模型的置信度,并使用相似度图在置信度较低的集群中导航检索。毕竟,鉴于这些图像的模型是不确定的,因此它们通常有一定的相似度。
当然,上述简短的分析也表明了,此类模型在如下场景中会遇到系统性的问题:
- 由于列车体积庞大,站在车厢外的人显得非常渺小
- 对于巴士和其他大型车辆而言,车内的人员几乎看不到
- 有人站在飞机的外面
- 食物的特写图片上有人的手或手指
您可以判断这些问题是否真的会影响您的人员检测目标,如果是的话,则应考虑使用额外的训练数据,来增强数据集,以优化模型在这些特定场景中的性能。
小结
综上所述,预训练模型和 Spotlight 等工具的使用,可以让我们的对象检测可视化过程变得更加容易,进而增强数据科学的工作流程。您可以使用自己的数据去尝试和体验上述代码。
译者介绍
陈峻(Julian Chen),51CTO社区编辑,具有十多年的IT项目实施经验,善于对内外部资源与风险实施管控,专注传播网络与信息安全知识与经验。
原文标题:How to Explore and Visualize ML-Data for Object Detection in Images,作者:Markus Stoll
链接:https://itnext.io/how-to-explore-and-visualize-ml-data-for-object-detection-in-images-88e074f46361。
The above is the detailed content of How to explore and visualize ML data for object detection in images. For more information, please follow other related articles on the PHP Chinese website!

Hot AI Tools

Undresser.AI Undress
AI-powered app for creating realistic nude photos

AI Clothes Remover
Online AI tool for removing clothes from photos.

Undress AI Tool
Undress images for free

Clothoff.io
AI clothes remover

AI Hentai Generator
Generate AI Hentai for free.

Hot Article
Hot Tools

Notepad++7.3.1
Easy-to-use and free code editor

SublimeText3 Chinese version
Chinese version, very easy to use

Zend Studio 13.0.1
Powerful PHP integrated development environment

Dreamweaver CS6
Visual web development tools

SublimeText3 Mac version
God-level code editing software (SublimeText3)
Hot Topics
 1378
1378
 52
52

 15 recommended open source free image annotation tools
Mar 28, 2024 pm 01:21 PM
15 recommended open source free image annotation tools
Mar 28, 2024 pm 01:21 PM
Image annotation is the process of associating labels or descriptive information with images to give deeper meaning and explanation to the image content. This process is critical to machine learning, which helps train vision models to more accurately identify individual elements in images. By adding annotations to images, the computer can understand the semantics and context behind the images, thereby improving the ability to understand and analyze the image content. Image annotation has a wide range of applications, covering many fields, such as computer vision, natural language processing, and graph vision models. It has a wide range of applications, such as assisting vehicles in identifying obstacles on the road, and helping in the detection and diagnosis of diseases through medical image recognition. . This article mainly recommends some better open source and free image annotation tools. 1.Makesens
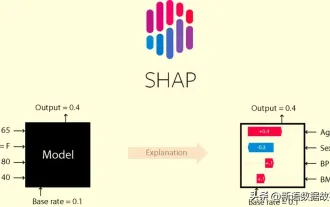 This article will take you to understand SHAP: model explanation for machine learning
Jun 01, 2024 am 10:58 AM
This article will take you to understand SHAP: model explanation for machine learning
Jun 01, 2024 am 10:58 AM
In the fields of machine learning and data science, model interpretability has always been a focus of researchers and practitioners. With the widespread application of complex models such as deep learning and ensemble methods, understanding the model's decision-making process has become particularly important. Explainable AI|XAI helps build trust and confidence in machine learning models by increasing the transparency of the model. Improving model transparency can be achieved through methods such as the widespread use of multiple complex models, as well as the decision-making processes used to explain the models. These methods include feature importance analysis, model prediction interval estimation, local interpretability algorithms, etc. Feature importance analysis can explain the decision-making process of a model by evaluating the degree of influence of the model on the input features. Model prediction interval estimate
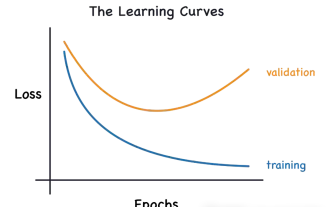 Identify overfitting and underfitting through learning curves
Apr 29, 2024 pm 06:50 PM
Identify overfitting and underfitting through learning curves
Apr 29, 2024 pm 06:50 PM
This article will introduce how to effectively identify overfitting and underfitting in machine learning models through learning curves. Underfitting and overfitting 1. Overfitting If a model is overtrained on the data so that it learns noise from it, then the model is said to be overfitting. An overfitted model learns every example so perfectly that it will misclassify an unseen/new example. For an overfitted model, we will get a perfect/near-perfect training set score and a terrible validation set/test score. Slightly modified: "Cause of overfitting: Use a complex model to solve a simple problem and extract noise from the data. Because a small data set as a training set may not represent the correct representation of all data." 2. Underfitting Heru
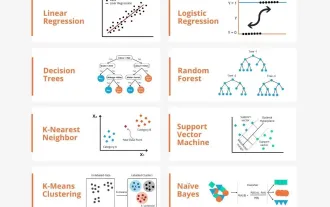 Transparent! An in-depth analysis of the principles of major machine learning models!
Apr 12, 2024 pm 05:55 PM
Transparent! An in-depth analysis of the principles of major machine learning models!
Apr 12, 2024 pm 05:55 PM
In layman’s terms, a machine learning model is a mathematical function that maps input data to a predicted output. More specifically, a machine learning model is a mathematical function that adjusts model parameters by learning from training data to minimize the error between the predicted output and the true label. There are many models in machine learning, such as logistic regression models, decision tree models, support vector machine models, etc. Each model has its applicable data types and problem types. At the same time, there are many commonalities between different models, or there is a hidden path for model evolution. Taking the connectionist perceptron as an example, by increasing the number of hidden layers of the perceptron, we can transform it into a deep neural network. If a kernel function is added to the perceptron, it can be converted into an SVM. this one
 The evolution of artificial intelligence in space exploration and human settlement engineering
Apr 29, 2024 pm 03:25 PM
The evolution of artificial intelligence in space exploration and human settlement engineering
Apr 29, 2024 pm 03:25 PM
In the 1950s, artificial intelligence (AI) was born. That's when researchers discovered that machines could perform human-like tasks, such as thinking. Later, in the 1960s, the U.S. Department of Defense funded artificial intelligence and established laboratories for further development. Researchers are finding applications for artificial intelligence in many areas, such as space exploration and survival in extreme environments. Space exploration is the study of the universe, which covers the entire universe beyond the earth. Space is classified as an extreme environment because its conditions are different from those on Earth. To survive in space, many factors must be considered and precautions must be taken. Scientists and researchers believe that exploring space and understanding the current state of everything can help understand how the universe works and prepare for potential environmental crises
 Implementing Machine Learning Algorithms in C++: Common Challenges and Solutions
Jun 03, 2024 pm 01:25 PM
Implementing Machine Learning Algorithms in C++: Common Challenges and Solutions
Jun 03, 2024 pm 01:25 PM
Common challenges faced by machine learning algorithms in C++ include memory management, multi-threading, performance optimization, and maintainability. Solutions include using smart pointers, modern threading libraries, SIMD instructions and third-party libraries, as well as following coding style guidelines and using automation tools. Practical cases show how to use the Eigen library to implement linear regression algorithms, effectively manage memory and use high-performance matrix operations.
 Explainable AI: Explaining complex AI/ML models
Jun 03, 2024 pm 10:08 PM
Explainable AI: Explaining complex AI/ML models
Jun 03, 2024 pm 10:08 PM
Translator | Reviewed by Li Rui | Chonglou Artificial intelligence (AI) and machine learning (ML) models are becoming increasingly complex today, and the output produced by these models is a black box – unable to be explained to stakeholders. Explainable AI (XAI) aims to solve this problem by enabling stakeholders to understand how these models work, ensuring they understand how these models actually make decisions, and ensuring transparency in AI systems, Trust and accountability to address this issue. This article explores various explainable artificial intelligence (XAI) techniques to illustrate their underlying principles. Several reasons why explainable AI is crucial Trust and transparency: For AI systems to be widely accepted and trusted, users need to understand how decisions are made
 Five schools of machine learning you don't know about
Jun 05, 2024 pm 08:51 PM
Five schools of machine learning you don't know about
Jun 05, 2024 pm 08:51 PM
Machine learning is an important branch of artificial intelligence that gives computers the ability to learn from data and improve their capabilities without being explicitly programmed. Machine learning has a wide range of applications in various fields, from image recognition and natural language processing to recommendation systems and fraud detection, and it is changing the way we live. There are many different methods and theories in the field of machine learning, among which the five most influential methods are called the "Five Schools of Machine Learning". The five major schools are the symbolic school, the connectionist school, the evolutionary school, the Bayesian school and the analogy school. 1. Symbolism, also known as symbolism, emphasizes the use of symbols for logical reasoning and expression of knowledge. This school of thought believes that learning is a process of reverse deduction, through existing
