
 Backend Development
Python Tutorial
Python Data Analysis: An Essential Guide for Data Scientists
Backend Development
Python Tutorial
Python Data Analysis: An Essential Guide for Data Scientists
Python Data Analysis: An Essential Guide for Data Scientists

introduction python is a powerful programming language that is highly respected in the field of data science. Its extensive library and tools package makes data processing, analysis and visualization a breeze. This article will delve into all aspects of Pythondata analysis to provide a comprehensive guide for data scientists.
Data processing and preparation Data processing is a key step in data analysis. Python provides a series of libraries, such as NumPy and pandas, for data structures, operations and cleaning. These libraries allow you to easily do the following:
import numpy as np
import pandas as pd

# 读取CSV文件
data = pd.read_csv("data.csv")

# 清除缺失值
data.fillna(data.mean(), inplace=True)

# 转换数据类型
data["Age"] = data["Age"].astype("int64")data visualization Data Visualization is essential for revealing patterns and trends in data. Python provides libraries such as Matplotlib and Seaborn for creating various types of charts and graphs.
import matplotlib.pyplot as plt

# 柱状图
data.Age.value_counts().plot.bar()
plt.title("年龄分布")
plt.show()

# 散点图
plt.scatter(data["Age"], data["Salary"])
plt.xlabel("年龄")
plt.ylabel("工资")
plt.show()Machine Learning Machine learning is an important part of data analysis, used to learn patterns from data and predict future outcomes. Python has libraries such as Scikit-learn, which can easily implement various machine learning algorithms.
from sklearn.linear_model import LinearRegression

# 创建线性回归模型
model = LinearRegression()

# 拟合模型
model.fit(data[["Age"]], data["Salary"])

# 预测工资
predicted_salary = model.predict([[30]])
deep learning Deep Learning is an advanced form of machine learning that is particularly suitable for processing large amounts of complex data. Python has libraries such as Tensorflow and PyTorch for building and training deep learning models.
import tensorflow as tf

# 创建序列模型
model = tf.keras.Sequential([
tf.keras.layers.Dense(128, activation="relu"),
tf.keras.layers.Dense(1)
])

# 编译模型
model.compile(optimizer="adam", loss="mean_squared_error")

# 训练模型
model.fit(data[["Age"]], data["Salary"], epochs=100)

# 评估模型
loss, mse = model.evaluate(data[["Age"]], data["Salary"])
in conclusion Python provides powerful tools and libraries for data science. By mastering the techniques outlined in this article, data scientists can effectively process, analyze, and visualize data, and leverage machine learning and deep learning algorithms to derive valuable insights from the data.
The above is the detailed content of Python Data Analysis: An Essential Guide for Data Scientists. For more information, please follow other related articles on the PHP Chinese website!

Hot AI Tools

Undresser.AI Undress
AI-powered app for creating realistic nude photos

AI Clothes Remover
Online AI tool for removing clothes from photos.

Undress AI Tool
Undress images for free

Clothoff.io
AI clothes remover

Video Face Swap
Swap faces in any video effortlessly with our completely free AI face swap tool!

Hot Article
Hot Tools

Notepad++7.3.1
Easy-to-use and free code editor

SublimeText3 Chinese version
Chinese version, very easy to use

Zend Studio 13.0.1
Powerful PHP integrated development environment

Dreamweaver CS6
Visual web development tools

SublimeText3 Mac version
God-level code editing software (SublimeText3)
Hot Topics
 1392
1392
 52
52

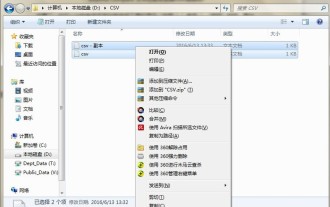 Detailed operation method of comparing CSV files with Beyond Compare
Apr 22, 2024 am 11:52 AM
Detailed operation method of comparing CSV files with Beyond Compare
Apr 22, 2024 am 11:52 AM
After installing the BeyondCompare software, select the CSV file to be compared, right-click the file and select the [Compare] option in the expanded menu. The text comparison session will be opened by default. You can click the text comparison session toolbar to display the [All [,] Differences [, and [Same]] buttons respectively to view the file differences more intuitively and accurately. Method 2: Open BeyondCompare in table comparison mode, select the table comparison session, and open the session operation interface. Click the [Open File] button and select the CSV file to be compared. Click the inequality sign [≠] button on the toolbar of the table comparison session operation interface to view the differences between the files.
 What software is good for python programming?
Apr 20, 2024 pm 08:11 PM
What software is good for python programming?
Apr 20, 2024 pm 08:11 PM
IDLE and Jupyter Notebook are recommended for beginners, and PyCharm, Visual Studio Code and Sublime Text are recommended for intermediate/advanced students. Cloud IDEs Google Colab and Binder provide interactive Python environments. Other recommendations include Anaconda Navigator, Spyder, and Wing IDE. Selection criteria include skill level, project size and personal preference.
 What does digital currency snapshot mean? Learn more about the digital currency snapshot in one article
Mar 26, 2024 am 09:51 AM
What does digital currency snapshot mean? Learn more about the digital currency snapshot in one article
Mar 26, 2024 am 09:51 AM
For some novice investors who have just entered the currency circle, they will always encounter some professional vocabulary during the investment process. These professional vocabulary are created to facilitate investors’ investment, but at the same time, these vocabulary may also be relatively Hard to understand. The digital currency snapshot we introduce to you today is a relatively professional concept in the currency circle. As we all know, the market of Bitcoin changes very quickly, so it is often necessary to take snapshots to understand the changes in the market and our operating processes. Many investors may still not know what digital currency snapshots mean. Now let the editor take you through an article to understand the digital currency snapshot. What does digital currency snapshot mean? A digital currency snapshot is a moment on a specified blockchain (i.e.
 How to solve the problem of garbled characters when importing Chinese data into Oracle?
Mar 10, 2024 am 09:54 AM
How to solve the problem of garbled characters when importing Chinese data into Oracle?
Mar 10, 2024 am 09:54 AM
Title: Methods and code examples to solve the problem of garbled characters when importing Chinese data into Oracle. When importing Chinese data into Oracle database, garbled characters often appear. This may be due to incorrect database character set settings or encoding conversion problems during the import process. . In order to solve this problem, we can take some methods to ensure that the imported Chinese data can be displayed correctly. The following are some solutions and specific code examples: 1. Check the database character set settings In the Oracle database, the character set settings are
 How to export the queried data in navicat
Apr 24, 2024 am 04:15 AM
How to export the queried data in navicat
Apr 24, 2024 am 04:15 AM
Export query results in Navicat: Execute query. Right-click the query results and select Export Data. Select the export format as needed: CSV: Field separator is comma. Excel: Includes table headers, using Excel format. SQL script: Contains SQL statements used to recreate query results. Select export options (such as encoding, line breaks). Select the export location and file name. Click "Export" to start the export.
 How to read csv in python
Mar 28, 2024 am 10:34 AM
How to read csv in python
Mar 28, 2024 am 10:34 AM
Reading method: 1. Create a python sample file; 2. Import the csv module, and then use the open function to open the CSV file; 3. Pass the file object to the csv.reader function, and then use a for loop to traverse and read each line of data; 4. , just print each line of data.
 What are the functions of access database?
Apr 10, 2024 pm 12:29 PM
What are the functions of access database?
Apr 10, 2024 pm 12:29 PM
Microsoft Access is a relational database management system for creating, managing, and querying databases, providing the following functionality: Data storage and management Data query and retrieval Form and report creation Data analysis and visualization Relational database management Automation and macros Multi-user support Database security portability
 How to read csv files with pycharm
Apr 03, 2024 pm 08:45 PM
How to read csv files with pycharm
Apr 03, 2024 pm 08:45 PM
The steps to read CSV files in PyCharm are as follows: Import the csv module. Open the CSV file using the open() function. Use the csv.reader() function to read CSV file contents. Iterate through each row and get the field data as a list. Process the data in the CSV file, such as printing or further processing.
