

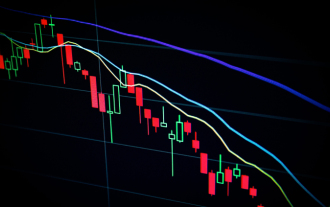
How to read K-line chart

There are three main aspects when looking at the K-line chart: 1. Check whether it is a positive line or a negative line. The positive line and the negative line represent the trend direction. The positive line indicates that there is an opportunity to continue to rise in the future, while the negative line indicates that there is a continued downward trend; 2. Look at the size of the entity. The column represents the price, and the size of the entity contains the internal power of the stock. 3. Look at the length of the shadow line. The shadow line has turning information about the direction change. That is, the longer the upper shadow line, the less likely it will be. Conducive to rising stock prices.

First of all, we must first understand what a K-line chart is. The K-line is a columnar line, which contains entities and shadow lines. The entity It is divided into Yang line and Yin line, also known as red (Yang) line and black (Yin) line. The record of a K-line is the price change of a certain stock in one day. The K-line graphically represents the increase, decrease, transformation process and actual results of the power of buyers and sellers. Above the entity is the upper shadow line, and below it is the lower shadow line.

1. Check whether it is a positive line or a negative line
In the stock market, the positive line and the negative line represent the trend direction, and the positive line indicates that there will be opportunities to continue to rise in the future. The negative line indicates that there is a continued downward trend. Take the Yang line as an example. After a period of long and short struggle, the closing price is higher than the opening, indicating that the bulls have the upper hand. According to Newton's mechanical theorem, the price will still run in the original direction and speed without external force, so the Yang line indicates the next stage. It will continue to rise, and at least it can ensure that it can surge upward in the early stages of the next stage. Therefore, the positive line often indicates continued rise, which is also very consistent with one of the three major assumptions in technical analysis: stock prices fluctuate along the trend, and this kind of following the trend is also the core idea of technical analysis. In the same way, the negative line can continue to fall.
2. Look at the size of the entity
The column in the K-line chart represents the price, and the size of the entity contains the internal power of the stock. The larger the entity, the greater the upward or downward trend. is obvious, but the opposite trend is not obvious. Taking the Yang line as an example, its real body is the part where the closing price is higher than the opening. The larger the real body of the Yang line, the more powerful it is to rise. Just like the physical principle that the greater the mass and the faster the speed of an object, the greater its inertial impulse. , the larger the real body of the Yang line is, the greater its internal rising power will be, and its rising power will be greater than that of the Yang line with a small real body. In the same way, the larger the Yinxian entity is, the stronger the downward momentum will be.
3. Look at the length of the shadow line
The shadow line in the K-line chart has turning information of direction change. The longer the shadow line in one direction, the less conducive it is for the stock price to move in that direction. Changes, that is, the longer the upper shadow line, the less conducive to the rise of the stock price, and the longer the lower shadow line, the less conducive to the fall of the stock price. Take the upper shadow line as an example. After a period of long-short struggle, the bulls were finally defeated late in the day. Once bitten by a snake, they will be afraid of ropes for ten years. No matter whether the K line is Yin or Yang, the upper shadow line has been It constitutes the upper resistance in the next stage, and the probability of downward adjustment of stock price is high. In the same way, the lower shadow line indicates that the probability of the stock price attacking upward is high.
1. Bald Yangxian. It shows that the long side is dominant. Generally speaking, the longer the positive line, the stronger the power of the long side, and the greater the possibility of price rise in the future. Such graphics mostly appear in K-line graphics that are less than 15 minutes.
2. Bald Yinxian. It shows that the short side is dominant. Generally speaking, the longer the negative line, the stronger the power of the short side, and the greater the possibility of price decline in the future. Such graphics mostly appear in K-line charts of less than 15 minutes.
3. Inverted tapered positive line. It shows that bulls have an advantage. If the upper shadow line is longer, it can reflect greater pressure on the rise, and the market outlook may fall; if the upper shadow line is shorter, the market outlook may consolidate and rise.
4. Inverted tapered negative line. It shows that the short side has the advantage, the price first rises and then falls, and there is a possibility of a fall in the market outlook.
5. Yang line with upper and lower shadow lines. It shows that after the long-short dispute, the bulls have a slight advantage, but the upward momentum is insufficient, and there is a possibility of a correction in the market outlook.
6. Yinxian with upper and lower shadow lines. It shows that after the long-short dispute, the short side has a slight advantage, but the decline has encountered resistance, and there is a possibility of a rebound in the market outlook.
7. Grand Cross Star. Most of them appear before the market reverses, indicating that the long and short sides are evenly matched and the price trend is facing a breakthrough. If the upper shadow line is longer, a downward breakthrough is more likely; if the lower shadow line is longer, an upward breakthrough is more likely.
8. Small cross star. The upper and lower shadow lines are shorter, indicating that both bulls and bears are not willing to enter the market, and the market outlook is mostly consolidation. I. Tapered positive line. It shows that bulls have the advantage, and if the lower shadow line is longer, the market outlook may rise more.
9. Tapered negative line. It shows that the short side has the advantage. If the lower shadow line is longer, the market rebound may be greater. If the lower shadow line is shorter, it may continue to fall.
10. Inverted T shape, also known as "tombstone shape". It shows that the stock price is weak and there is a risk of falling in the market outlook.
11. T-shaped. It shows that the decline in the exchange rate is blocked and there is a possibility of rising in the market outlook.
The above is the detailed content of How to read K-line chart. For more information, please follow other related articles on the PHP Chinese website!

Hot AI Tools

Undresser.AI Undress
AI-powered app for creating realistic nude photos

AI Clothes Remover
Online AI tool for removing clothes from photos.

Undress AI Tool
Undress images for free

Clothoff.io
AI clothes remover

AI Hentai Generator
Generate AI Hentai for free.

Hot Article
Hot Tools

Notepad++7.3.1
Easy-to-use and free code editor

SublimeText3 Chinese version
Chinese version, very easy to use

Zend Studio 13.0.1
Powerful PHP integrated development environment

Dreamweaver CS6
Visual web development tools

SublimeText3 Mac version
God-level code editing software (SublimeText3)
Hot Topics
 1377
1377
 52
52

 Qubetics ($TICS): The Revolutionizing AI Crypto
Mar 23, 2025 am 10:08 AM
Qubetics ($TICS): The Revolutionizing AI Crypto
Mar 23, 2025 am 10:08 AM
Cryptocurrency has always been a realm where the cutting edge of technology meets bold ambition, and it's only getting more exciting in the future. As artificial intelligence continues to grow in influence, there are a handful of digital assets that
![Bitcoin [BTC] was on a downtrend after losing the $92,000-support level in the final week of February](https://img.php.cn/upload/article/001/246/273/174209101774967.jpg?x-oss-process=image/resize,m_fill,h_207,w_330) Bitcoin [BTC] was on a downtrend after losing the $92,000-support level in the final week of February
Mar 16, 2025 am 10:10 AM
Bitcoin [BTC] was on a downtrend after losing the $92,000-support level in the final week of February
Mar 16, 2025 am 10:10 AM
Technical indicators such as the OBV showed that selling pressure has been dominant, meaning more losses may be likely ahead.
 Pi Network (PI) Price Falls Despite Successful PiFest 2025 Event
Apr 03, 2025 am 10:08 AM
Pi Network (PI) Price Falls Despite Successful PiFest 2025 Event
Apr 03, 2025 am 10:08 AM
Pi Network recently held PiFest 2025, an event aimed at increasing the token's adoption. Over 125,000 sellers and 58,000 merchants participated
 Top 10 digital currency app platforms rankings Virtual currency exchange latest rankings in 2025
Mar 13, 2025 pm 06:45 PM
Top 10 digital currency app platforms rankings Virtual currency exchange latest rankings in 2025
Mar 13, 2025 pm 06:45 PM
Top 10 digital currency app platforms: 1. OKX, 2. Binance, 3. Gate.io, 4. Kraken, 5. Coinbase, 6. Huobi, 7. KuCoin, 8. Crypto.com, 9. Bitfinex, 10. Gemini; these platforms are ranked according to factors such as transaction volume, security and user experience. When choosing, the platform's security, liquidity, transaction fees, currency selection, user interface and customer support should be considered.
 Where to download the genuine Ouyi? Official website download. Global
Mar 31, 2025 pm 02:09 PM
Where to download the genuine Ouyi? Official website download. Global
Mar 31, 2025 pm 02:09 PM
Ouyi usually refers to Ouyi OKX. The global way to download Ouyi OKX APP is as follows: 1. Android device: Download the APK file through the official website and install it. 2. iOS device: access the official website through the browser and directly download the APP.
 Cyber criminals were able to steal cryptocurrency worth 1.5 billion US dollars
Mar 16, 2025 am 11:12 AM
Cyber criminals were able to steal cryptocurrency worth 1.5 billion US dollars
Mar 16, 2025 am 11:12 AM
Since then, the provider has been investigating how this could have happened and how it will (hopefully) not happen again in the future.
 BlockDAG Launches Beta Testnet With $200M Raised, Ethereum Approaches $2,000 & Tether Expands Into Media
Apr 03, 2025 am 10:34 AM
BlockDAG Launches Beta Testnet With $200M Raised, Ethereum Approaches $2,000 & Tether Expands Into Media
Apr 03, 2025 am 10:34 AM
Ethereum (ETH) price edges toward resistance, Tether news reveals a €10M media deal, and BlockDAG reaches new milestones with Beta Testnet and growing adoption.
 okx Ouyi Exchange web version enter link click to enter
Mar 31, 2025 pm 06:21 PM
okx Ouyi Exchange web version enter link click to enter
Mar 31, 2025 pm 06:21 PM
1. Enter the web version of okx Euyi Exchange ☜☜☜☜☜☜ Click to save 2. Click the link of okx Euyi Exchange app ☜☜☜☜ Click to save 3. After entering the official website, the clear interface provides a login and registration portal. Users can choose to log in to an existing account or register a new account according to their own situation. Whether it is viewing real-time market conditions, conducting transactions, or managing assets, the OKX web version provides a simple and smooth operating experience, suitable for beginners and veterans. Visit OKX official website now for easy experience