PHP Jenkins and Xdebug: Debugging PHP code easily
php editor Youzi will take you to explore the powerful combination of PHP Jenkins and Xdebug, presenting you with an easy and efficient journey of debugging PHP code. As a popular continuous integration tool, Jenkins, combined with the powerful debugging function of Xdebug, can help developers locate and solve problems in PHP code more quickly and improve development efficiency. In this article, we will take an in-depth look at how to use these two tools to optimize your PHP development workflow and make coding easier and more enjoyable.
As a PHP developer, debugging code is a crucial part of the development process. It helps you find bugs quickly, shorten fix time, and improve the overall quality of your code. However, debugging php code can sometimes be a time-consuming and tedious process.
PHP Jenkins and Xdebug Overview
PHPjenkins and Xdebug are two tools that can significantly simplify the debugging process of PHP code. PHP Jenkins is a continuous integration (CI) server that can automatically build, test and deploy your code. Xdebug is a PHP extension that allows you to step through code, inspect variables and stack traces, and configure breakpoints.
Debugging with PHP Jenkins and Xdebug
1. Install and configure PHP Jenkins
- Install Jenkins on your server.
- Create a new Jenkins
- project. Configure the build step to run your PHP tests.
2. Install and configure Xdebug
- Install the Xdebug extension into your PHP installation.
- Configure php.ini to enable Xdebug.
- Associate the Xdebug debugger with the Jenkins project.
3. Configure breakpoints
- Set breakpoints in your code.
- When the code is executed to the breakpoint, Jenkins will trigger the Xdebug debugger.
4. Debugging code
- Use the Xdebug debugger to step through your code.
- Check variables, stack traces and runtime environment.
- Modify the code and rerun the test.
Sample code:
<?php

function addNumbers($a, $b) {
// 设置断点
xdebug_break();
return $a + $b;
}

$result = addNumbers(1, 2);
echo $result; // 输出:3benefit:
- Automated builds and tests: Jenkins can automatically build and test your code, reducing manual tasks.
- Remote debugging: Xdebug allows you to debug your code remotely, even if the code is not running locally.
- Efficient error discovery: Xdebug can help you find errors quickly by stepping through your code.
- Improve code quality: Xdebug can help you improve the quality and robustness of your code by finding and fixing errors.
- Save Time: PHP Jenkins and Xdebug can save a lot of time by automating the debugging process.
in conclusion
PHP Jenkins and Xdebug are powerful tools for debugging PHP code. They can significantly speed up the development process and improve code quality by automating builds and tests, providing remote debugging capabilities, and helping to find and fix bugs. If you are looking for a more efficient and easier way to debug PHP code, then PHP Jenkins and Xdebug are highly recommended.The above is the detailed content of PHP Jenkins and Xdebug: Debugging PHP code easily. For more information, please follow other related articles on the PHP Chinese website!

Hot AI Tools

Undresser.AI Undress
AI-powered app for creating realistic nude photos

AI Clothes Remover
Online AI tool for removing clothes from photos.

Undress AI Tool
Undress images for free

Clothoff.io
AI clothes remover

AI Hentai Generator
Generate AI Hentai for free.

Hot Article

Hot Tools

Notepad++7.3.1
Easy-to-use and free code editor

SublimeText3 Chinese version
Chinese version, very easy to use

Zend Studio 13.0.1
Powerful PHP integrated development environment

Dreamweaver CS6
Visual web development tools

SublimeText3 Mac version
God-level code editing software (SublimeText3)

Hot Topics
 CakePHP Project Configuration
Sep 10, 2024 pm 05:25 PM
In this chapter, we will understand the Environment Variables, General Configuration, Database Configuration and Email Configuration in CakePHP.
 PHP 8.4 Installation and Upgrade guide for Ubuntu and Debian
Dec 24, 2024 pm 04:42 PM
PHP 8.4 brings several new features, security improvements, and performance improvements with healthy amounts of feature deprecations and removals. This guide explains how to install PHP 8.4 or upgrade to PHP 8.4 on Ubuntu, Debian, or their derivati
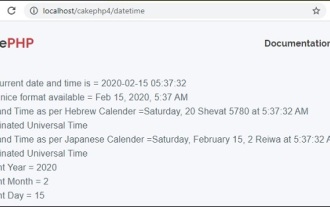 CakePHP Date and Time
Sep 10, 2024 pm 05:27 PM
To work with date and time in cakephp4, we are going to make use of the available FrozenTime class.
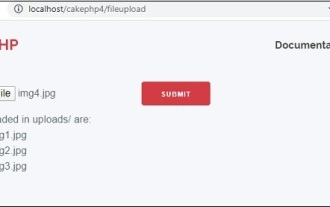 CakePHP File upload
Sep 10, 2024 pm 05:27 PM
To work on file upload we are going to use the form helper. Here, is an example for file upload.
 CakePHP Routing
Sep 10, 2024 pm 05:25 PM
In this chapter, we are going to learn the following topics related to routing ?
 Discuss CakePHP
Sep 10, 2024 pm 05:28 PM
CakePHP is an open-source framework for PHP. It is intended to make developing, deploying and maintaining applications much easier. CakePHP is based on a MVC-like architecture that is both powerful and easy to grasp. Models, Views, and Controllers gu
 CakePHP Creating Validators
Sep 10, 2024 pm 05:26 PM
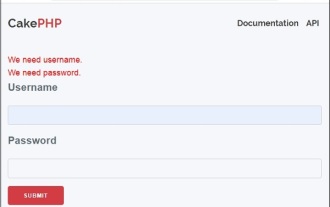
Validator can be created by adding the following two lines in the controller.
 How To Set Up Visual Studio Code (VS Code) for PHP Development
Dec 20, 2024 am 11:31 AM
Visual Studio Code, also known as VS Code, is a free source code editor — or integrated development environment (IDE) — available for all major operating systems. With a large collection of extensions for many programming languages, VS Code can be c


