
 System Tutorial
LINUX
Detailed explanation of MySQL performance indicators and calculation methods
System Tutorial
LINUX
Detailed explanation of MySQL performance indicators and calculation methods
Detailed explanation of MySQL performance indicators and calculation methods

Most MySQL performance indicators can be obtained in the following two ways:
MySQL performance indicators obtained using the mysqladmin extended-status command default to cumulative values. If you want to understand the current status, you need to calculate the difference; add the parameter --relative(-r), you can see the difference of each indicator, and use the parameter --sleep(-i) Specify how often to refresh.

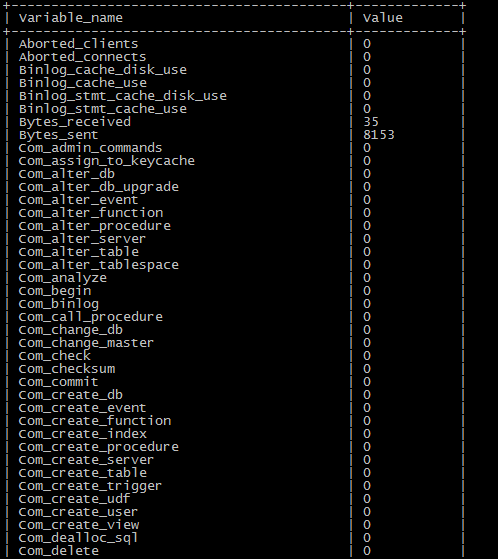
Can list various status values of MySQL server running, cumulative value.
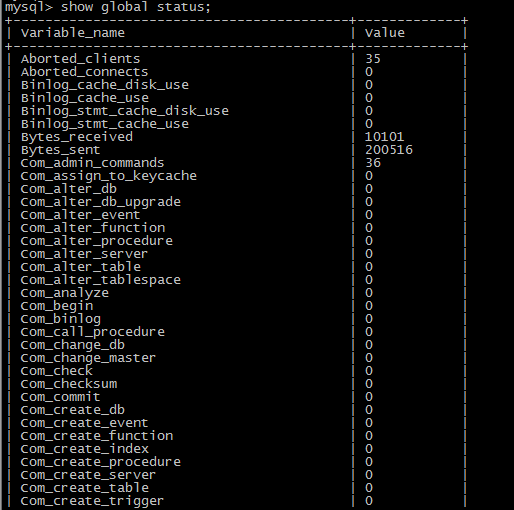
Mysqladmin extended-status command and show global status get a lot of indicator items. In practical applications, focus on the following performance indicators:
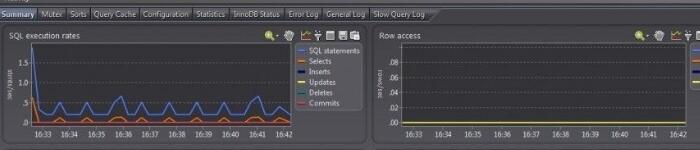
tps: Transactions Per Second, number of transactions per second;
qps: Queries Per Second Number of queries per second;
There are usually two ways to calculate tps/qps:
Method 1: Calculate tps based on com_commit and com_rollback, and calculate qps based on questions.
TPS = Com_commit/s Com_rollback/s
in,
Com_commit /s= mysqladmin extended-status --relative --sleep=1|grep -w Com_commit
Com_rollback/s = mysqladmin extended-status --relative --sleep=1|grep -w Com_rollback
QPS refers to the total amount of Query executed by MySQL Server per second, which is approximately represented by the change in the Questions (number of customer queries) status value per second, so there are:
QPS = mysqladmin extended-status --relative --sleep=1|grep -w Questions
You can also get the number of mysql select, insert, update, delete, etc. per second by following the above method, such as:
Com_select/s = mysqladmin extended-status --relative --sleep=1|grep -w Com_select
Com_select/s: Average number of select statement executions per second
Com_insert/s: average number of insert statement executions per second
Com_update/s: Average number of update statement executions per second
Com_delete/s: average number of delete statement executions per second
Method 2: Calculate tps based on com_%, qps
tps= Com_insert/s Com_update/s Com_delete/s
qps=Com_select/s Com_insert/s Com_update/s Com_delete/s
threads_running: The number of threads currently active
threads_connected: The number of currently connected threads
Bytes_received/s: Average number of bytes received from all clients per second, unit KB
Bytes_sent/s: The average number of bytes sent to all clients per second, unit KB
innodb_data_reads: The average number of times innodb reads from the file per second
innodb_data_writes: The average number of times innodb writes from the file per second
innodb_data_fsyncs: The average number of fsync() operations performed by innodb per second
innodb_data_read: The average amount of data read by innodb per second, in KB
innodb_data_written: The average amount of data written by innodb per second, in KB
innodb_buffer_pool_reads: Average number of pages read from the physical disk per second
innodb_buffer_pool_read_requests: Average number of reads from the innodb buffer pool per second (number of logical read requests)
innodb_buffer_pool_write_requests: Average number of writes to the innodb buffer pool per second
innodb_buffer_pool_pages_dirty: The average number of dirty pages in the innodb cache pool per second
innodb_buffer_pool_pages_flushed: The average number of page refresh requests in the innodb cache pool per second
Innodb buffer pool read hit rate
innodb_buffer_read_hit_ratio = ( 1 - Innodb_buffer_pool_reads/Innodb_buffer_pool_read_requests) * 100
Innodb buffer pool utilization
Innodb_buffer_usage = ( 1 - Innodb_buffer_pool_pages_free / Innodb_buffer_pool_pages_total) * 100
innodb_os_log_fsyncs: Average number of fsync() writes to the log file per second
innodb_os_log_written: Average number of bytes written to the log file per second
innodb_log_writes: Average number of physical writes to the log file per second
innodb_log_write_requests: Average number of log write requests per second
innodb_rows_deleted: The average number of rows deleted from the innodb table per second
innodb_rows_inserted: Average number of rows inserted from the innodb table per second
innodb_rows_read: The average number of rows read from the innodb table per second
innodb_rows_updated: The average number of rows updated from the innodb table per second
innodb_row_lock_waits: The number of times a row must wait for a lock
innodb_row_lock_time: The total time spent on row locking, in milliseconds
innodb_row_lock_time_avg: average row lock time, in milliseconds
key_read_requests: The average number of MyISAM reads from the buffer pool per second
Key_write_requests: The average number of MyISAM writes from the buffer pool per second
key_reads: The average number of times MyISAM reads from the hard disk per second
key_writes: The average number of times MyISAM writes from the hard disk per second
MyISAM average key buffer utilization per second
Key_usage_ratio =Key_blocks_used/(Key_blocks_used Key_blocks_unused)*100
MyISAM average key buffer read hit rate per second
Key_read_hit_ratio=(1-Key_reads/Key_read_requests)*100
MyISAM average key buffer write hit rate per second
Key_write_hit_ratio =(1-Key_writes/Key_write_requests)*100
Created_tmp_disk_tables: The number of temporary tables automatically created on the hard disk when the server executes a statement
Created_tmp_tables: The number of temporary tables in memory that are automatically created when the server executes a statement
The ratio of Created_tmp_disk_tables/Created_tmp_tables should not exceed 10%. If the value of Created_tmp_tables is relatively large, there may be too many sorting sentences or the connection sentences are not optimized enough
slow_queries: Number of queries whose execution time exceeds long_query_time seconds (important)
sort_rows: Number of sorted rows
open_files: Number of open files
open_tables: Number of currently open tables
select_scan: The number of joins for a full scan of the first table
In addition, there are some performance indicators that cannot be obtained directly through mysqladmin extended-status or show global status, but they are very important.
Percona provides the tcprstat tool to count response times. This function is turned off by default. This function can be turned on by setting the parameter query_response_time_stats=1.
There are two ways to check the response time:
(1) View response time statistics through the command SHOW QUERY_RESPONSE_TIME;
(2) View through the table QUERY_RESPONSE_TIME in INFORMATION_SCHEMA.
http://www.orczhou.com/index.php/2011/09/thanks-percona-response-time-distribution/comment-page-1/(reference article)
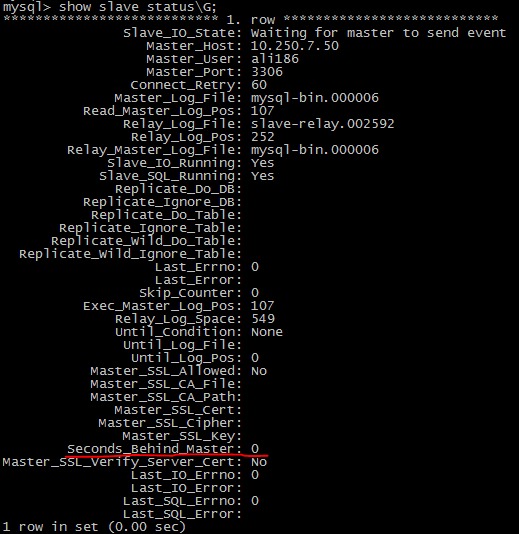
You can execute the show slave status\G command on the slave node. The value of the Seconds_Behind_Master item is the current delay of the slave, in seconds.
The above is the detailed content of Detailed explanation of MySQL performance indicators and calculation methods. For more information, please follow other related articles on the PHP Chinese website!

Hot AI Tools

Undresser.AI Undress
AI-powered app for creating realistic nude photos

AI Clothes Remover
Online AI tool for removing clothes from photos.

Undress AI Tool
Undress images for free

Clothoff.io
AI clothes remover

Video Face Swap
Swap faces in any video effortlessly with our completely free AI face swap tool!

Hot Article
Hot Tools

Notepad++7.3.1
Easy-to-use and free code editor

SublimeText3 Chinese version
Chinese version, very easy to use

Zend Studio 13.0.1
Powerful PHP integrated development environment

Dreamweaver CS6
Visual web development tools

SublimeText3 Mac version
God-level code editing software (SublimeText3)
Hot Topics
 1386
1386
 52
52

 How to use docker desktop
Apr 15, 2025 am 11:45 AM
How to use docker desktop
Apr 15, 2025 am 11:45 AM
How to use Docker Desktop? Docker Desktop is a tool for running Docker containers on local machines. The steps to use include: 1. Install Docker Desktop; 2. Start Docker Desktop; 3. Create Docker image (using Dockerfile); 4. Build Docker image (using docker build); 5. Run Docker container (using docker run).
 Difference between centos and ubuntu
Apr 14, 2025 pm 09:09 PM
Difference between centos and ubuntu
Apr 14, 2025 pm 09:09 PM
The key differences between CentOS and Ubuntu are: origin (CentOS originates from Red Hat, for enterprises; Ubuntu originates from Debian, for individuals), package management (CentOS uses yum, focusing on stability; Ubuntu uses apt, for high update frequency), support cycle (CentOS provides 10 years of support, Ubuntu provides 5 years of LTS support), community support (CentOS focuses on stability, Ubuntu provides a wide range of tutorials and documents), uses (CentOS is biased towards servers, Ubuntu is suitable for servers and desktops), other differences include installation simplicity (CentOS is thin)
 What to do if the docker image fails
Apr 15, 2025 am 11:21 AM
What to do if the docker image fails
Apr 15, 2025 am 11:21 AM
Troubleshooting steps for failed Docker image build: Check Dockerfile syntax and dependency version. Check if the build context contains the required source code and dependencies. View the build log for error details. Use the --target option to build a hierarchical phase to identify failure points. Make sure to use the latest version of Docker engine. Build the image with --t [image-name]:debug mode to debug the problem. Check disk space and make sure it is sufficient. Disable SELinux to prevent interference with the build process. Ask community platforms for help, provide Dockerfiles and build log descriptions for more specific suggestions.
 How to view the docker process
Apr 15, 2025 am 11:48 AM
How to view the docker process
Apr 15, 2025 am 11:48 AM
Docker process viewing method: 1. Docker CLI command: docker ps; 2. Systemd CLI command: systemctl status docker; 3. Docker Compose CLI command: docker-compose ps; 4. Process Explorer (Windows); 5. /proc directory (Linux).
 Detailed explanation of docker principle
Apr 14, 2025 pm 11:57 PM
Detailed explanation of docker principle
Apr 14, 2025 pm 11:57 PM
Docker uses Linux kernel features to provide an efficient and isolated application running environment. Its working principle is as follows: 1. The mirror is used as a read-only template, which contains everything you need to run the application; 2. The Union File System (UnionFS) stacks multiple file systems, only storing the differences, saving space and speeding up; 3. The daemon manages the mirrors and containers, and the client uses them for interaction; 4. Namespaces and cgroups implement container isolation and resource limitations; 5. Multiple network modes support container interconnection. Only by understanding these core concepts can you better utilize Docker.
 What computer configuration is required for vscode
Apr 15, 2025 pm 09:48 PM
What computer configuration is required for vscode
Apr 15, 2025 pm 09:48 PM
VS Code system requirements: Operating system: Windows 10 and above, macOS 10.12 and above, Linux distribution processor: minimum 1.6 GHz, recommended 2.0 GHz and above memory: minimum 512 MB, recommended 4 GB and above storage space: minimum 250 MB, recommended 1 GB and above other requirements: stable network connection, Xorg/Wayland (Linux)
 How to switch Chinese mode with vscode
Apr 15, 2025 pm 11:39 PM
How to switch Chinese mode with vscode
Apr 15, 2025 pm 11:39 PM
VS Code To switch Chinese mode: Open the settings interface (Windows/Linux: Ctrl, macOS: Cmd,) Search for "Editor: Language" settings Select "Chinese" in the drop-down menu Save settings and restart VS Code
 What is vscode What is vscode for?
Apr 15, 2025 pm 06:45 PM
What is vscode What is vscode for?
Apr 15, 2025 pm 06:45 PM
VS Code is the full name Visual Studio Code, which is a free and open source cross-platform code editor and development environment developed by Microsoft. It supports a wide range of programming languages and provides syntax highlighting, code automatic completion, code snippets and smart prompts to improve development efficiency. Through a rich extension ecosystem, users can add extensions to specific needs and languages, such as debuggers, code formatting tools, and Git integrations. VS Code also includes an intuitive debugger that helps quickly find and resolve bugs in your code.
