
 Technology peripherals
AI
Add SOTA in real time and skyrocket! FastOcc: Faster inference and deployment-friendly Occ algorithm is here!
Technology peripherals
AI
Add SOTA in real time and skyrocket! FastOcc: Faster inference and deployment-friendly Occ algorithm is here!
Add SOTA in real time and skyrocket! FastOcc: Faster inference and deployment-friendly Occ algorithm is here!

Written before&The author’s personal understanding
In the autonomous driving system, the perception task is a crucial component of the entire autonomous driving system. The main goal of the perception task is to enable autonomous vehicles to understand and perceive surrounding environmental elements, such as vehicles driving on the road, pedestrians on the roadside, obstacles encountered during driving, traffic signs on the road, etc., thereby helping downstream modules Make correct and reasonable decisions and actions. A vehicle with self-driving capabilities is usually equipped with different types of information collection sensors, such as surround-view camera sensors, lidar sensors, millimeter-wave radar sensors, etc., to ensure that the self-driving vehicle can accurately perceive and understand surrounding environment elements. , enabling autonomous vehicles to make correct decisions during autonomous driving.
Currently, pure image-based visual perception methods have lower hardware costs and deployment costs than lidar-based perception algorithms, and therefore have received widespread attention from industry and academia. Many excellent visual perception algorithms have emerged to achieve 3D object perception tasks and semantic segmentation tasks in BEV scenes. Although existing 3D target perception algorithms have made significant progress in detection performance, there are still some problems that are gradually revealed in practical applications:
- The original 3D target perception algorithm cannot perform well It solves the long-tail problem that exists in the data set, as well as the objects that exist in the real world but may not be labeled in the current training data set (such as: large rocks on the road, overturned vehicles, etc.)
- Original Some 3D target perception algorithms usually directly output a rough 3D stereoscopic bounding box and cannot accurately describe target objects of arbitrary shapes. The expression of object shape and geometric structure is not fine-grained enough. Although this output result box can satisfy most object scenes, for example, connected buses or construction vehicles with long hooks, the current 3D perception algorithm cannot give an accurate and clear description
Based on the related issues mentioned above, the grid occupancy network (Occupancy Network) sensing algorithm was proposed. Essentially, the Occupancy Network perception algorithm is a semantic segmentation task based on 3D spatial scenes. The Occupancy Network perception algorithm based on pure vision will divide the current 3D space into 3D voxel grids, and send the collected surrounding images to the network model through the surrounding camera sensor equipped on the autonomous vehicle. After the algorithm model Processing and prediction, output the occupancy status of each 3D voxel grid in the current space and the possible target semantic categories, thereby achieving a comprehensive perception of the current 3D space scene.
In recent years, the perception algorithm based on Occupancy Network has received extensive attention from researchers due to its better perception advantages. At present, many excellent works have emerged to improve the detection performance of this type of algorithm. The general direction of these papers is: proposing more robust feature extraction methods, coordinate transformation methods from 2D features to 3D features, more complex network structure designs, and how to more accurately generate Occupancy ground truth annotations to help model learning, etc. However, many existing Occupancy Network perception methods have serious computational overhead in the process of model prediction and inference, making it difficult for these algorithms to meet the requirements of real-time perception for autonomous driving and difficult to deploy in vehicles.
We propose an innovative Occupancy Network prediction method. Compared with current leading perception algorithms, our FastOcc algorithm has real-time inference speed and excellent detection performance. The following figure can visually compare the difference in performance and inference speed between our proposed algorithm and other algorithms.
 Comparison of accuracy and inference speed between FastOcc algorithm and other SOTA algorithms
Paper link: https://arxiv.org/pdf/2403.02710.pdf
Overall architecture & details of the network model
In order to improve the inference speed of the Occupancy Network perception algorithm, we extracted the backbone network from the resolution of the input image, the feature extraction method, the method of perspective conversion, and the raster Experiments were conducted on four parts of the prediction head structure. Through the experimental results, it was found that the three-dimensional convolution or deconvolution in the grid prediction head has a large space for time-consuming optimization. Based on this, we designed the network structure of the FastOcc algorithm, as shown in the figure below.
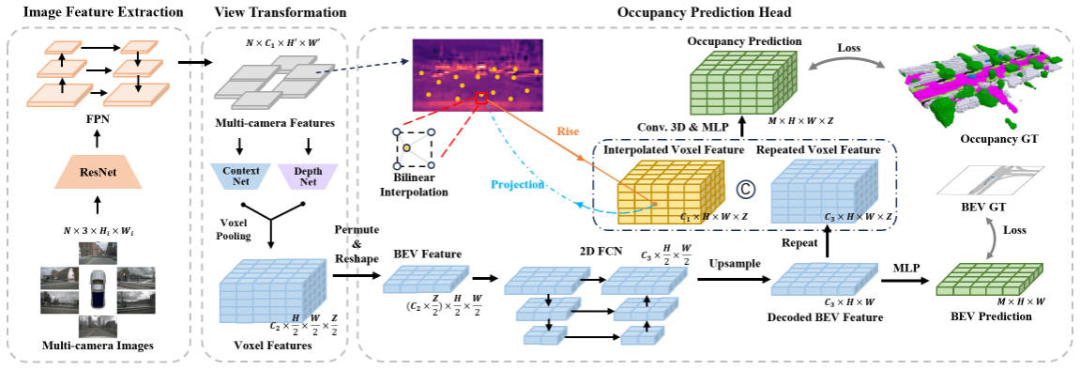 FastOcc algorithm network structure diagram
Overall, the proposed FastOcc algorithm includes three sub-modules, which are Image Feature Extraction for multi-scale feature extraction , View Transformation is used for perspective conversion, and Occupancy Prediction Head is used to achieve perceptual output. Next, we will introduce the details of these three parts respectively.
Image Feature Extraction
For the proposed FastOcc algorithm, the network input is still the collected surround image. Here we use the ResNet network structure to complete Feature extraction process for surround images. At the same time, we also use the FPN feature pyramid structure to aggregate the multi-scale image features output by the backbone network. For the convenience of subsequent expression, here we represent the input image as , and the features after feature extraction as .
View Transformation
The main function of the view transformation module is to complete the conversion process of 2D image features to 3D space features, and at the same time, in order to reduce the overhead of the algorithm model , usually the features converted to 3D space will be expressed roughly. For convenience of expression here, we mark the features converted to 3D space as , which represents the dimension of the embedded feature vector and represents the length, width and height of the perceptual space. Among the current perception algorithms, the mainstream perspective conversion process includes two categories:
- One is the Backward coordinate transformation method represented by BEVFormer. This type of method usually generates a voxel query in 3D space first, and then uses Cross-view Attention to interact with the voxel query in 3D space and 2D image features to complete the construction of the final 3D voxel feature.
- The first category is the Forward coordinate transformation method represented by LSS. This type of method will use the depth estimation network in the network to simultaneously estimate the semantic feature information and discrete depth probability of each feature pixel position, construct the semantic frustum feature through the outer product operation, and finally use the VoxelPooling layer to achieve the final 3D voxel feature. of construction.
Considering that the LSS algorithm has better reasoning speed and efficiency, in this article, we adopt the LSS algorithm as our perspective conversion module. At the same time, considering that the discrete depth of each pixel position is estimated, its uncertainty will restrict the final perceptual performance of the model to a certain extent. Therefore, in our specific implementation, we utilize point cloud information for supervision in the depth direction to achieve better perception results.
Raster Prediction Head (Occupancy Prediction Head)
In the network structure diagram shown above, the grid prediction head also contains three sub-parts, namelyBEV feature extraction, Image feature interpolation sampling, Feature integration. Next, we will introduce the details of the three-part method one by one.
BEV feature extraction
Currently, most Occupancy Network algorithms process the 3D voxel features obtained by the perspective conversion module. The processing form is generally a three-dimensional fully convolutional network. Specifically, for any layer of the three-dimensional fully convolutional network, the amount of calculation required to convolve the input three-dimensional voxel features is as follows:
where, and represent the input features and output features respectively. The number of channels represents the size of the feature map space. Compared to processing voxel features directly in 3D space, we use a lightweight 2D BEV feature convolution module. Specifically, for the output voxel features of the perspective conversion module, we first fuse height information and semantic features to obtain 2D BEV features, and then use a 2D fully convolutional network to perform feature extraction to obtain BEV features. The feature extraction of this 2D process The calculation amount of the process can be expressed in the following form
It can be seen from the comparison of the calculation amount of the 3D and 2D processing processes that the original 3D voxel features are replaced by the lightweight 2D BEV feature convolution module Extraction can significantly reduce the computational effort of a model. At the same time, the visual flow charts of the two types of processing processes are shown below:
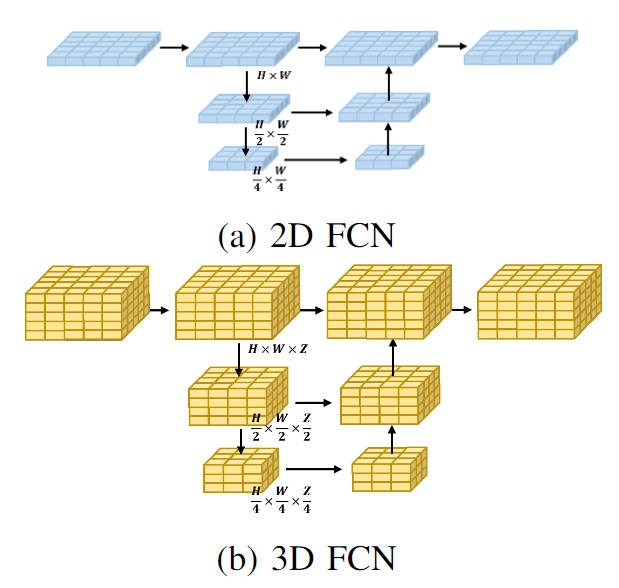
Visualization of 2D FCN and 3D FCN network structures
Image Feature interpolation sampling
In order to reduce the calculation amount of the raster prediction head module, we compress the height of the 3D voxel features output by the perspective conversion module, and use the 2D BEV convolution module for feature extraction . However, in order to increase the missing Z-axis height feature information and adhere to the idea of reducing the amount of model calculations, we proposed an image feature interpolation sampling method.
Specifically, we first set the corresponding three-dimensional voxel space according to the range that needs to be sensed, and assign it to the ego coordinate system, denoted as. Secondly, the camera's extrinsic and intrinsic coordinate transformation matrices are used to project the coordinate points in the ego coordinate system to the image coordinate system, which is used to extract image features at the corresponding positions.
Among them, and represent the intrinsic and extrinsic coordinate transformation matrices of the camera respectively, representing the position of the spatial point in the ego coordinate system projected to the image coordinate system. After obtaining the corresponding image coordinates, we filter out coordinate points that exceed the image range or have negative depth. Then, we use bilinear interpolation operation to obtain the corresponding image semantic features based on the projected coordinate position, and average the features collected from all camera images to obtain the final interpolation sampling result.
Feature integration
In order to integrate the obtained planar BEV features with the 3D voxel features obtained by interpolation sampling, we first use the upsampling operation to combine the spatial dimensions of the BEV features with the 3D The spatial dimensions of the voxel features are aligned, and a repeat operation is performed along the Z-axis direction. The features obtained after the operation are recorded as . Then we concat the features obtained by interpolation sampling of image features and integrate them through a convolutional layer to obtain the final voxel feature.
The above-mentioned image feature interpolation sampling and feature integration process can be represented by the following figure:
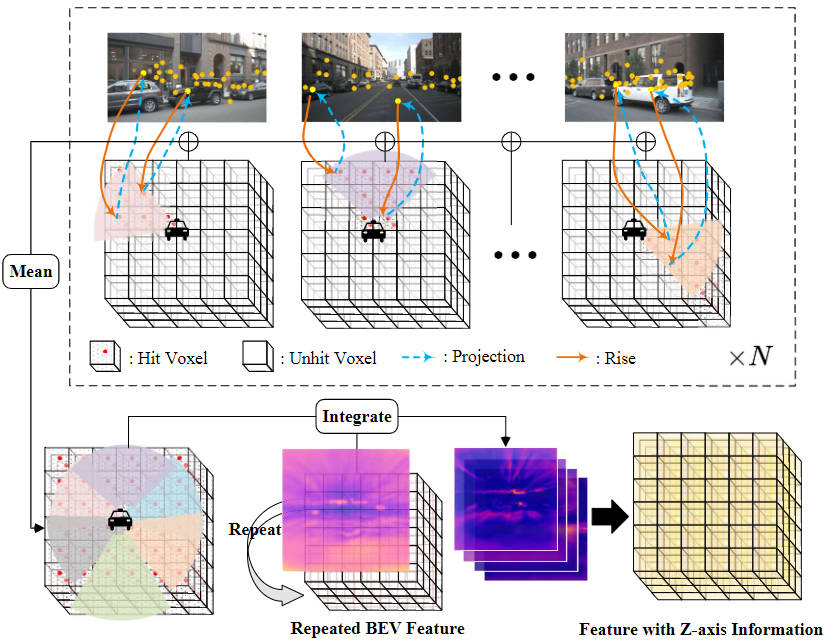
Image feature interpolation sampling and feature integration process
In addition, in order to further ensure that the BEV features output by the BEV feature extraction module contain sufficient feature information to complete the subsequent perception process, we adopted an additional supervision method, that is, using a semantic segmentation Let’s start with the semantic segmentation task first, and use the true value of Occupancy to construct the true value label of semantic segmentation to complete the entire supervision process.
Experimental results & evaluation indicators
Quantitative analysis part
First show the FastOcc algorithm we proposed in Occ3D-nuScenes The comparison between the data set and other SOTA algorithms. The specific indicators of each algorithm are shown in the table below
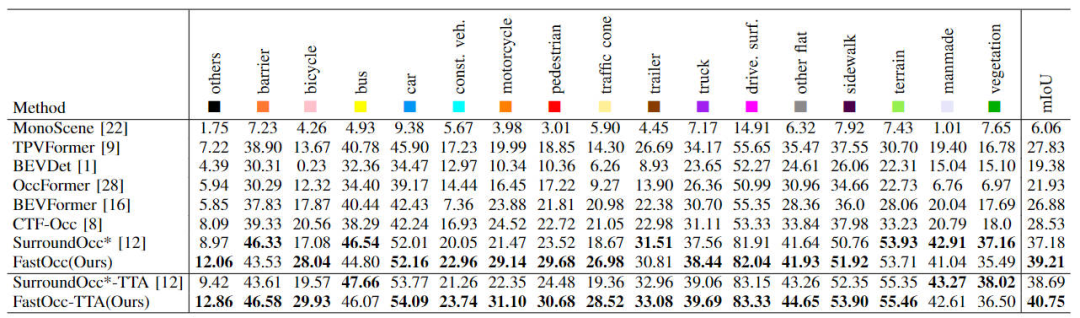
Comparison of each algorithm indicator on the Occ3D-nuScenes data set
It can be seen from the results in the table that the FastOcc algorithm we proposed has more advantages in most categories than other algorithms. At the same time, the overall mIoU index also achieves SOTA Effect.
In addition, we also compared the impact of different perspective conversion methods and the decoding feature module used in the raster prediction head on perceptual performance and reasoning time (the experimental data are all based on the input image The resolution is 640×1600, and the backbone network uses the ResNet-101 network). The relevant experimental results are compared as shown in the table below

Different perspective conversions and raster prediction heads Comparison of accuracy and inference time consumption
The SurroundOcc algorithm uses a multi-scale Cross-view Attention perspective conversion method and 3D convolution to extract 3D voxel features, and has the highest inference time consumption. After we replaced the original Cross-view Attention perspective conversion method with the LSS conversion method, the mIoU accuracy has been improved and the time consumption has been reduced. On this basis, by replacing the original 3D convolution with a 3D FCN structure, the accuracy can be further increased, but the reasoning time is also significantly increased. Finally, we chose the coordinate conversion method of sampling LSS and the 2D FCN structure to achieve a balance between detection performance and inference time consumption.
In addition, we also verified the effectiveness of our proposed semantic segmentation supervision task based on BEV features and image feature interpolation sampling. The specific ablation experimental results are shown in the following table:
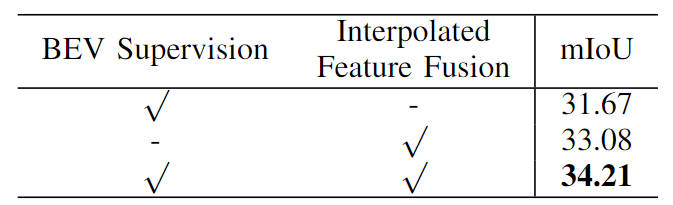
Comparison of ablation experiments of different modules
In addition, we also conducted scale experiments on the model. By controlling the size of the backbone network and the resolution of the input image, we constructed a Set Occupancy Network perception algorithm model (FastOcc, FastOcc-Small, FastOcc-Tiny), the specific configuration is shown in the table below:
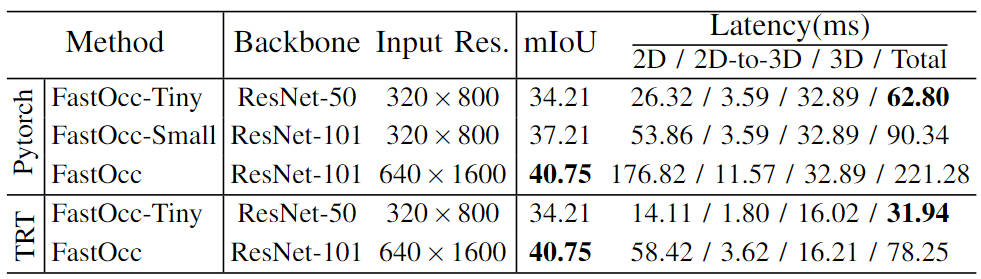
Model capabilities under different backbone network and resolution configurations Comparison
Qualitative analysis part
The following figure shows the comparison of the visual results of our proposed FastOcc algorithm model and the SurroundOcc algorithm model. It can be clearly seen that the proposed The FastOcc algorithm model fills in the surrounding environment elements in a more reasonable way and achieves more accurate perception of driving vehicles and trees.
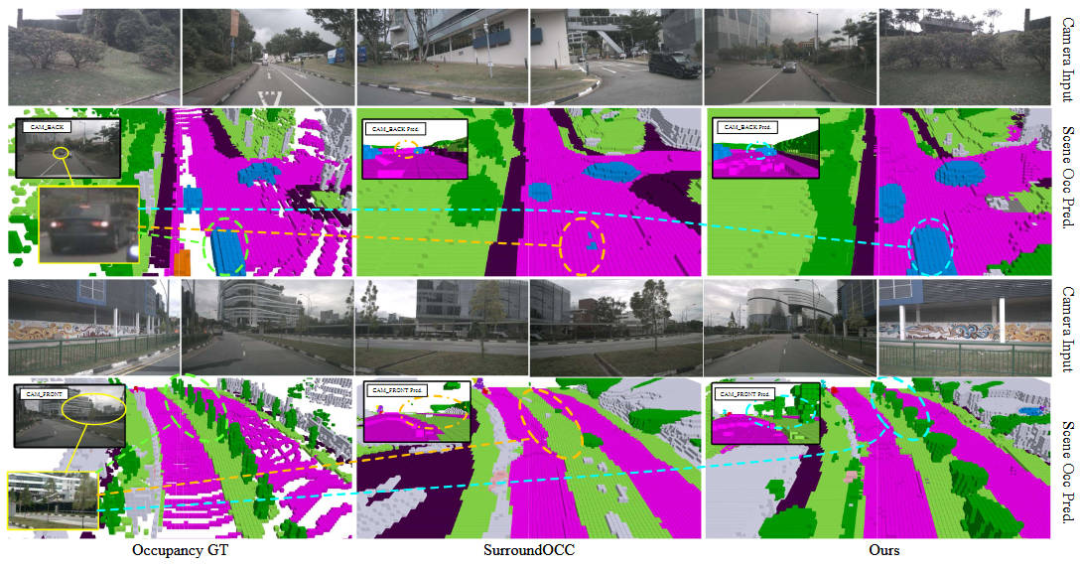
Comparison of visualization results between FastOcc algorithm and SurroundOcc algorithm
Conclusion
In this article, we proposed the FastOcc algorithm model to solve the problem that the existing Occupancy Network algorithm model takes a long time to detect and is difficult to deploy on the vehicle. By replacing the original 3D convolution module that processes 3D voxels with 2D convolution, the reasoning time is greatly shortened, and compared with other algorithms, SOTA perception results are achieved.
The above is the detailed content of Add SOTA in real time and skyrocket! FastOcc: Faster inference and deployment-friendly Occ algorithm is here!. For more information, please follow other related articles on the PHP Chinese website!

Hot AI Tools

Undresser.AI Undress
AI-powered app for creating realistic nude photos

AI Clothes Remover
Online AI tool for removing clothes from photos.

Undress AI Tool
Undress images for free

Clothoff.io
AI clothes remover

AI Hentai Generator
Generate AI Hentai for free.

Hot Article
Hot Tools

Notepad++7.3.1
Easy-to-use and free code editor

SublimeText3 Chinese version
Chinese version, very easy to use

Zend Studio 13.0.1
Powerful PHP integrated development environment

Dreamweaver CS6
Visual web development tools

SublimeText3 Mac version
God-level code editing software (SublimeText3)
Hot Topics


 Solution to i7-7700 unable to upgrade to Windows 11
Dec 26, 2023 pm 06:52 PM
Solution to i7-7700 unable to upgrade to Windows 11
Dec 26, 2023 pm 06:52 PM
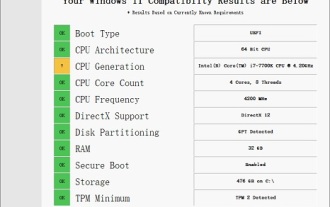
The performance of i77700 is completely sufficient to run win11, but users find that their i77700 cannot be upgraded to win11. This is mainly due to restrictions imposed by Microsoft, so they can install it as long as they skip this restriction. i77700 cannot be upgraded to win11: 1. Because Microsoft limits the CPU version. 2. Only the eighth generation and above versions of Intel can directly upgrade to win11. 3. As the 7th generation, i77700 cannot meet the upgrade needs of win11. 4. However, i77700 is completely capable of using win11 smoothly in terms of performance. 5. So you can use the win11 direct installation system of this site. 6. After the download is complete, right-click the file and "load" it. 7. Double-click to run the "One-click
 CLIP-BEVFormer: Explicitly supervise the BEVFormer structure to improve long-tail detection performance
Mar 26, 2024 pm 12:41 PM
CLIP-BEVFormer: Explicitly supervise the BEVFormer structure to improve long-tail detection performance
Mar 26, 2024 pm 12:41 PM
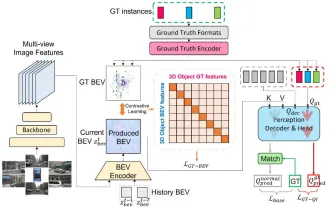
Written above & the author’s personal understanding: At present, in the entire autonomous driving system, the perception module plays a vital role. The autonomous vehicle driving on the road can only obtain accurate perception results through the perception module. The downstream regulation and control module in the autonomous driving system makes timely and correct judgments and behavioral decisions. Currently, cars with autonomous driving functions are usually equipped with a variety of data information sensors including surround-view camera sensors, lidar sensors, and millimeter-wave radar sensors to collect information in different modalities to achieve accurate perception tasks. The BEV perception algorithm based on pure vision is favored by the industry because of its low hardware cost and easy deployment, and its output results can be easily applied to various downstream tasks.
 Implementing Machine Learning Algorithms in C++: Common Challenges and Solutions
Jun 03, 2024 pm 01:25 PM
Implementing Machine Learning Algorithms in C++: Common Challenges and Solutions
Jun 03, 2024 pm 01:25 PM
Common challenges faced by machine learning algorithms in C++ include memory management, multi-threading, performance optimization, and maintainability. Solutions include using smart pointers, modern threading libraries, SIMD instructions and third-party libraries, as well as following coding style guidelines and using automation tools. Practical cases show how to use the Eigen library to implement linear regression algorithms, effectively manage memory and use high-performance matrix operations.
 MIT's latest masterpiece: using GPT-3.5 to solve the problem of time series anomaly detection
Jun 08, 2024 pm 06:09 PM
MIT's latest masterpiece: using GPT-3.5 to solve the problem of time series anomaly detection
Jun 08, 2024 pm 06:09 PM
Today I would like to introduce to you an article published by MIT last week, using GPT-3.5-turbo to solve the problem of time series anomaly detection, and initially verifying the effectiveness of LLM in time series anomaly detection. There is no finetune in the whole process, and GPT-3.5-turbo is used directly for anomaly detection. The core of this article is how to convert time series into input that can be recognized by GPT-3.5-turbo, and how to design prompts or pipelines to let LLM solve the anomaly detection task. Let me introduce this work to you in detail. Image paper title: Largelanguagemodelscanbezero-shotanomalydete
 Explore the underlying principles and algorithm selection of the C++sort function
Apr 02, 2024 pm 05:36 PM
Explore the underlying principles and algorithm selection of the C++sort function
Apr 02, 2024 pm 05:36 PM
The bottom layer of the C++sort function uses merge sort, its complexity is O(nlogn), and provides different sorting algorithm choices, including quick sort, heap sort and stable sort.
 Can artificial intelligence predict crime? Explore CrimeGPT's capabilities
Mar 22, 2024 pm 10:10 PM
Can artificial intelligence predict crime? Explore CrimeGPT's capabilities
Mar 22, 2024 pm 10:10 PM
The convergence of artificial intelligence (AI) and law enforcement opens up new possibilities for crime prevention and detection. The predictive capabilities of artificial intelligence are widely used in systems such as CrimeGPT (Crime Prediction Technology) to predict criminal activities. This article explores the potential of artificial intelligence in crime prediction, its current applications, the challenges it faces, and the possible ethical implications of the technology. Artificial Intelligence and Crime Prediction: The Basics CrimeGPT uses machine learning algorithms to analyze large data sets, identifying patterns that can predict where and when crimes are likely to occur. These data sets include historical crime statistics, demographic information, economic indicators, weather patterns, and more. By identifying trends that human analysts might miss, artificial intelligence can empower law enforcement agencies
 Improved detection algorithm: for target detection in high-resolution optical remote sensing images
Jun 06, 2024 pm 12:33 PM
Improved detection algorithm: for target detection in high-resolution optical remote sensing images
Jun 06, 2024 pm 12:33 PM
01 Outlook Summary Currently, it is difficult to achieve an appropriate balance between detection efficiency and detection results. We have developed an enhanced YOLOv5 algorithm for target detection in high-resolution optical remote sensing images, using multi-layer feature pyramids, multi-detection head strategies and hybrid attention modules to improve the effect of the target detection network in optical remote sensing images. According to the SIMD data set, the mAP of the new algorithm is 2.2% better than YOLOv5 and 8.48% better than YOLOX, achieving a better balance between detection results and speed. 02 Background & Motivation With the rapid development of remote sensing technology, high-resolution optical remote sensing images have been used to describe many objects on the earth’s surface, including aircraft, cars, buildings, etc. Object detection in the interpretation of remote sensing images
 Application of algorithms in the construction of 58 portrait platform
May 09, 2024 am 09:01 AM
Application of algorithms in the construction of 58 portrait platform
May 09, 2024 am 09:01 AM
1. Background of the Construction of 58 Portraits Platform First of all, I would like to share with you the background of the construction of the 58 Portrait Platform. 1. The traditional thinking of the traditional profiling platform is no longer enough. Building a user profiling platform relies on data warehouse modeling capabilities to integrate data from multiple business lines to build accurate user portraits; it also requires data mining to understand user behavior, interests and needs, and provide algorithms. side capabilities; finally, it also needs to have data platform capabilities to efficiently store, query and share user profile data and provide profile services. The main difference between a self-built business profiling platform and a middle-office profiling platform is that the self-built profiling platform serves a single business line and can be customized on demand; the mid-office platform serves multiple business lines, has complex modeling, and provides more general capabilities. 2.58 User portraits of the background of Zhongtai portrait construction
