How to create a sales data page for sales PPT
In sales work, PPT is a common tool, and the production of sales data pages in PPT is particularly important. How to create a compelling sales data page? This article is introduced to you in detail by PHP editor Zimo, including techniques in layout design, data display, chart selection, etc., to help you improve your PPT production level, better display sales data, attract the audience's attention, and improve the presentation effect.
We use picture data as an example
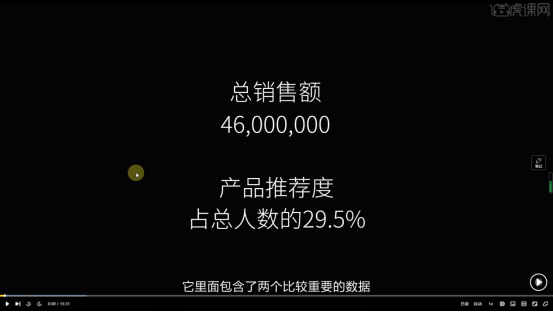
#1. First, let’s analyze it. As total sales, it is undoubtedly a very important data and should be used as For the main body, enlarge the number of sales, as shown in the picture:
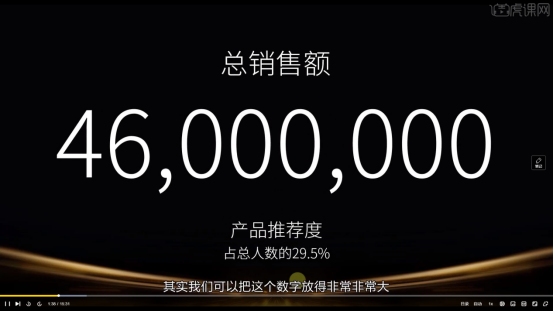
2. Consider how our text and background fit together:
Change the color of the text, Here sales are tied to money and we can use a gold gradient. As shown in the picture:
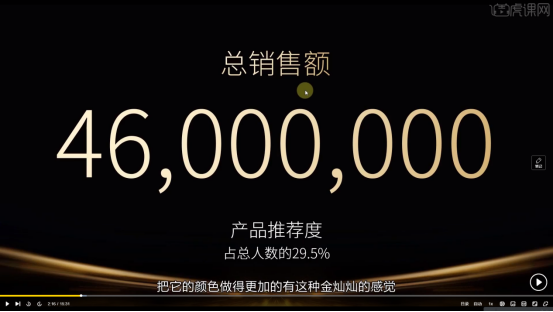
#Change the font. Here we use Siyuan Blackbody, which can appear more professional. The total sales volume can be tilted to give the whole picture a kind of The sense of speed, as shown in the picture:

We can add a little bit of detail according to the picture. We can add a glare under "Total Sales", as shown in the picture:

Here, we can use a graphic design called negative space to combine the inside of the fourth number "0" with the rising arrow. This is a very clever design. , suggesting that sales are still increasing.

3. We can depict the product percentage below in the form of a villain, which not only makes the real picture more vivid and vivid, but also makes it more intuitive, as shown in the figure Display:
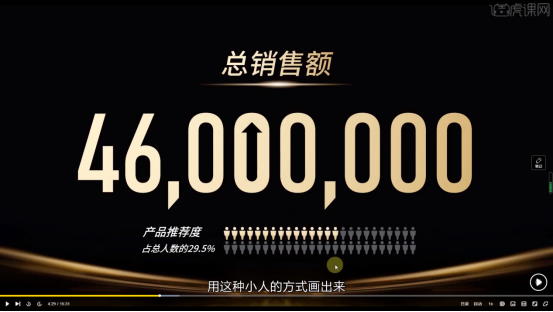
4. Add some elements to the overall picture, such as glare and geometric figures, to make the picture dynamic, as shown in the picture:

How about it? Isn’t the final rendering very cool! As long as you learn some of these tips, you can also shine in your sales slides, so hurry up and learn!
The above is the detailed content of How to create a sales data page for sales PPT. For more information, please follow other related articles on the PHP Chinese website!

Hot AI Tools

Undresser.AI Undress
AI-powered app for creating realistic nude photos

AI Clothes Remover
Online AI tool for removing clothes from photos.

Undress AI Tool
Undress images for free

Clothoff.io
AI clothes remover

AI Hentai Generator
Generate AI Hentai for free.

Hot Article

Hot Tools

Notepad++7.3.1
Easy-to-use and free code editor

SublimeText3 Chinese version
Chinese version, very easy to use

Zend Studio 13.0.1
Powerful PHP integrated development environment

Dreamweaver CS6
Visual web development tools

SublimeText3 Mac version
God-level code editing software (SublimeText3)

Hot Topics
 1378
1378
 52
52
 Specific method to create film movement effect in PPT
Mar 26, 2024 pm 04:00 PM
1. Start PPT, create a new blank document, select all text boxes and delete them. 2. Execute the Insert-Shape command, drag a rectangle in the document, and fill the shape with black. 3. Drag the rectangle to elongate it, execute the Insert-Shape command, drag out the small square, and set the fill color to white. 4. Copy and paste the small squares one by one so that the top and bottom are evenly distributed on both sides of the film. After selecting them all with ctrl+a, right-click and select Group. 5. Execute the Insert-Picture command, find the picture to be inserted in the pop-up dialog box, click to open, and adjust the size and position of the picture. 6. Repeat step 5 to insert and set the remaining pictures in order to form a film picture. 7. Select the film, execute animation-add animation command
 How to make a tomato novel cover
Feb 23, 2024 pm 01:55 PM
How to make the cover of Tomato novel? You can make exclusive novel cover in Tomato novel, but most friends don’t know how to make the cover of Tomato novel. Next is the picture of how to make the cover of Tomato novel brought by the editor to the players. Tutorial, interested players come and take a look! Tomato Novel usage tutorial How to make a Tomato Novel cover 1. First open the Tomato Novel APP, enter the work management page to create a new book, and select the [Cover Template] as shown by the arrow below; 2. Then enter the cover template page and select your favorite cover Template; 3. After finally selecting the cover, click [Confirm] in the upper right corner.
 Operation guide for creating mobile Excel tables
Feb 18, 2024 pm 02:41 PM
Mobile Excel table creation tutorial With the popularity of mobile devices and the continuous advancement of technology, mobile phones have become one of the indispensable tools in our daily life and work. Using Excel spreadsheets on your mobile phone can easily record, calculate and analyze data and improve work efficiency. This article will share with you the basic operations and techniques for creating mobile Excel tables. 1. Choose the right application. There are many mobile Excel applications on the market to choose from, such as GoogleSheets, Micro
 Let me teach you! How to create animation effects in PPT!
Mar 20, 2024 pm 06:40 PM
When making PPT, using some animation effects will make it more lively and cute than without using animation effects. With the addition of animation effects, people may like to watch this PPT, so we must learn how to create animation effects for PPT. Next, I will introduce in detail how to add animation effects to PPT. Please continue reading and study these steps carefully. I believe they will be helpful to you! First, open the PPT we made ourselves. You will notice that this PPT currently does not have any animation effects (as shown by the red arrow in the picture below). 2. Then, we need to add animation effects to the picture. We first select the picture, and then click the [Animation] button on the menu bar (as shown in the red circle in the figure below). 3. Next, we click inside the animation
 How to use CSS to create a countdown effect
Oct 26, 2023 am 10:36 AM
How to use CSS to create a countdown effect. The countdown effect is a common function in web development. It can provide users with a dynamic effect of countdown and give people a sense of urgency and expectation. This article will introduce how to use CSS to achieve the countdown effect, and give detailed implementation steps and code examples. The implementation steps are as follows: Step 1: HTML structure construction First, create a div container in HTML to wrap the countdown content. For example: <divclass="countd
 How to make a word cover
Mar 19, 2024 pm 06:50 PM
A graduation thesis must have a cover, a table of contents, an end, etc. Only then can the thesis be complete. In the last issue, the editor has shared with friends how to make a table of contents in Word. In this issue, I will share with you how to make a word cover. If you don’t know how to make it, hurry up! 1. First, we open the word document we want to make a cover, as shown in the figure below: 2. Then, we click the [Chapter] button on the menu bar and select the cover page. This function is equivalent to a cover library, in which you can Choose a suitable and beautiful cover by yourself, as shown in the red circle in the picture below: 3. After clicking, you can see various types of covers, such as business type, suitable for company contracts and documents; resume type, suitable for job hunting and submission of resumes Friends, wait, okay?
 How to make ppt What is the process of making ppt
Feb 22, 2024 pm 05:00 PM
Click the insert option in the software, create a new blank presentation, enter the subject and text, and set the display order of text and objects. Applicable model of the tutorial: Lenovo AIO520C System: Windows 10 Professional Edition: PowerPoint 2022 Analysis 1 After opening the PPT, click the file option and select New Blank Presentation. 2Input the topic and text, and add audio, picture, video and other effects. 3Finally, set the display order and animation effects of text and objects as required. Supplement: How to insert a video into ppt 1. First click to open the PowerPoint software, and after entering, click the insert option in the upper left corner. 2 Then click the video option in the upper right corner. 3. A pop-up box will appear, click on the video from the file. 4Then select
 How to make Fushengyi Linglong snail noodles
Mar 07, 2024 pm 04:34 PM
In the game "Fu Sheng Yi Ling Long", players can make various delicacies through recipes. Many players don't know how to make snail noodles. To make snail noodles, you need to prepare four ingredients: rice, mountain spring water, bamboo shoots, and snails. How to make Fushengyi Linglong Snail Noodles: Use rice, mountain spring water, bamboo shoots and snails for cooking. 1. To make snail noodles, players need to prepare four materials: rice, mountain spring water, bamboo shoots, and snails. 2. After the collection is completed, players can freely cook on the stove. 3. In the game "Fu Sheng Yi Ling Long", players who are chefs can use ingredients to freely cook different foods. 4. If you want to make specific food, you need to match the corresponding ingredients.


