
 Software Tutorial
Office Software
Detailed method of inserting Excel circular data chart into PPT
Software Tutorial
Office Software
Detailed method of inserting Excel circular data chart into PPT
Detailed method of inserting Excel circular data chart into PPT

php editor Xinyi introduces you to the detailed method of inserting excel circular data chart into PPT. When making PPT, circular data charts are a commonly used display method, which can visually display the proportional relationship of data. By converting data in excel tables into donut charts, you can make PPT more vivid and easier to understand. The following will introduce in detail how to insert an Excel circular data chart into PPT, allowing you to easily create professional presentations.
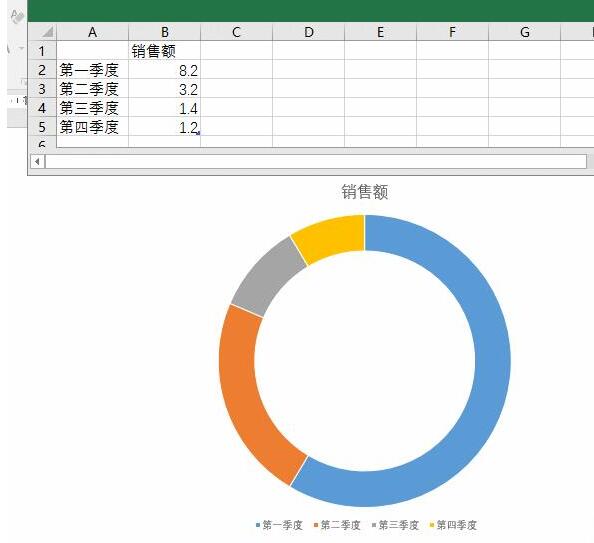
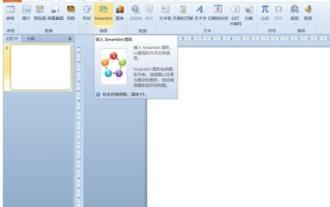
1. Create a new PPT page and insert the Excel ring chart.
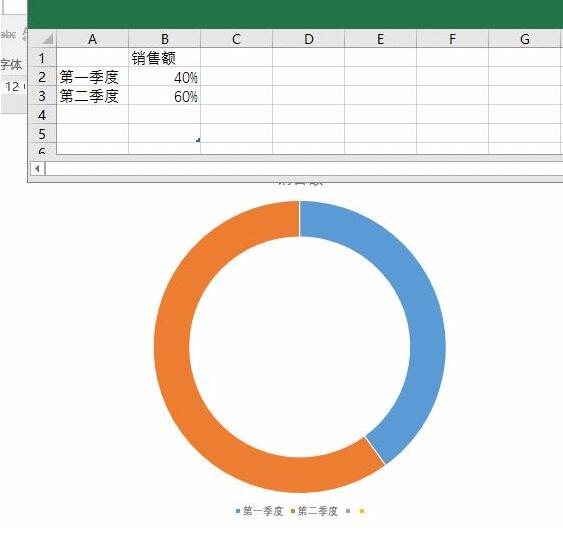
2. Delete the redundant data in the table, leaving two rows of data, and set them in percentage form to facilitate parameter setting.
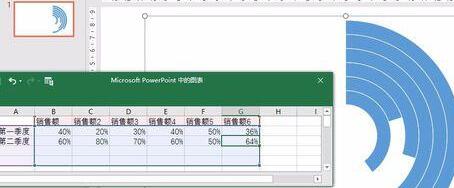
3. Copy the data in column B to other columns according to the display needs. From the sample picture of this column, you can see what it looks like when copying 5 columns. Pay attention to why the animation operation does not use dragging cells to copy, but the honest and practical method of copying and pasting. You will experience it when you actually operate it.
4. After copying N pieces, set the orange part to no color, and you are done.
Note:
1. Use PPT to make information charts like this. You can use graphical drawing or Excel data to make them accurately
2. This technique is valid for Excel 2007 and above.
The above is the detailed content of Detailed method of inserting Excel circular data chart into PPT. For more information, please follow other related articles on the PHP Chinese website!

Hot AI Tools

Undresser.AI Undress
AI-powered app for creating realistic nude photos

AI Clothes Remover
Online AI tool for removing clothes from photos.

Undress AI Tool
Undress images for free

Clothoff.io
AI clothes remover

AI Hentai Generator
Generate AI Hentai for free.

Hot Article
Hot Tools

Notepad++7.3.1
Easy-to-use and free code editor

SublimeText3 Chinese version
Chinese version, very easy to use

Zend Studio 13.0.1
Powerful PHP integrated development environment

Dreamweaver CS6
Visual web development tools

SublimeText3 Mac version
God-level code editing software (SublimeText3)
Hot Topics
 1384
1384
 52
52

 How to insert excel icons into PPT slides
Mar 26, 2024 pm 05:40 PM
How to insert excel icons into PPT slides
Mar 26, 2024 pm 05:40 PM
1. Open the PPT and turn the page to the page where you need to insert the excel icon. Click the Insert tab. 2. Click [Object]. 3. The following dialog box will pop up. 4. Click [Create from file] and click [Browse]. 5. Select the excel table to be inserted. 6. Click OK and the following page will pop up. 7. Check [Show as icon]. 8. Click OK.
 How to remove the date that appears automatically when printing from PPT handouts
Mar 26, 2024 pm 08:16 PM
How to remove the date that appears automatically when printing from PPT handouts
Mar 26, 2024 pm 08:16 PM
1. Let me first talk about the method I used at the beginning, maybe everyone is using it too. First, open [View]——]Remarks Template[. 2. A place where you can actually see the date after opening it. 3. Select it first and delete it. 4. After deleting, click [Close Master View]. 5. Open the print preview again and find that the date is still there. 6. In fact, this date was not deleted here. It should be in the [Handout Master]. Look at the picture below. 7. Delete the date after you find it. 8. Now when you open the preview and take a look, the date is no longer there. Note: In fact, this method is also very easy to remember, because the printed handouts are handouts, so you should look for the [Handout Master].
 Detailed method of inserting formula effect flow chart into PPT
Mar 26, 2024 pm 04:36 PM
Detailed method of inserting formula effect flow chart into PPT
Mar 26, 2024 pm 04:36 PM
1. Open PPT, click the [Insert] tab, and click the [smartArt] button in the [Illustrations] group. 2. Click [Process] in the [Select smartArt graphics] dialog box that opens. 3. Select the [Formula] flow chart in the [Process] pane that opens. 4. Click [OK], and the [Formula] flow chart will be inserted into the slide pane. 5. Click [Text] in the [Type text here] column, or click [Text] on the graphic to enter content. 6. Select the shape in the graphic, click the [Design] tab of [smartArt Tools], and click the [Add Shape] button in the [Create Graphics] group to add a shape. 7. The shapes in the graphics can also be selected and deleted. Of course, you can also delete them in smar as needed.
 Introduction to the method of inserting heptagons into PPT slides
Mar 26, 2024 pm 07:46 PM
Introduction to the method of inserting heptagons into PPT slides
Mar 26, 2024 pm 07:46 PM
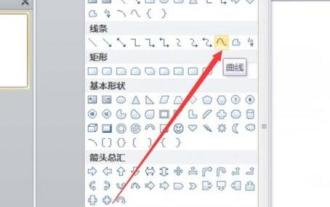
1. Open the PPT slide document, and in the [Outline, Slide] column on the left side of the PPT, click to select the slide where you want to insert the basic [shape]. 2. After selecting, select the [Insert] menu in the function menu bar above the PPT and click. 3. After clicking the [Insert] menu, the [Insert] submenu bar pops up below the function menu bar. Select the [Shape] menu in the [Insert] submenu bar. 4. Click the [Shape] menu to pop up the preset shape type selection page. 5. In the shape type selection page, select the [Heptagon] shape and click. 6. After clicking, move the mouse to the slide editing interface, press the mouse to draw, and release the mouse after the drawing is completed. Complete the insertion of the [heptagon] shape.
 PPT operation content for drawing the animation of a bird flying over
Mar 26, 2024 pm 05:06 PM
PPT operation content for drawing the animation of a bird flying over
Mar 26, 2024 pm 05:06 PM
1. Open the PPT software, create a new slide, and insert an arc from the menu bar. 2. Copy the arc that has been set, and then move the arc to form the shape of the sea surface. 3. Insert a picture of a bird from [Insert], [Picture] in the menu bar. Then set the image size larger. 4. Click [Animation] on the menu bar, select the picture, set the animation to a custom path, and select left. 5. Copy a picture and set the custom animation path to arc downward. 6. Select the first picture, set the picture animation duration to a longer point, and then extend the picture animation path to the left end of the slide.
 Detailed steps to create text with chalk font effect in PPT
Mar 26, 2024 pm 04:50 PM
Detailed steps to create text with chalk font effect in PPT
Mar 26, 2024 pm 04:50 PM
1. If you want to get a good-looking effect, you can match the PPT with the corresponding [blackboard] background image. 2. First create the materials for [Chalk Lettering]. Draw a shape in [Insert]-[Shape], any shape can be used, fill it with black. 3. Copy the drawn shape and paste it as a [picture]. 4. Delete the drawn shape and set the [Artistic Effect] of the pasted picture to [Line Drawing]. 5. In [Artistic Effect]-[Artistic Effect Options], reduce [Transparency] and increase the value of [Pencil Size]. 6. [Picture Tools]-[Color]-[Set Transparent Color] Set the transparent color to black. 7. In】Set picture format【-】Picture color【Recolor picture】【. 8. In the ppt page, insert a [text box] and enter text. 9. Complex
 How to read excel data in html
Mar 27, 2024 pm 05:11 PM
How to read excel data in html
Mar 27, 2024 pm 05:11 PM
How to read excel data in html: 1. Use JavaScript library to read Excel data; 2. Use server-side programming language to read Excel data.
 How to deal with blanks when playing PPT slides
Mar 26, 2024 pm 07:51 PM
How to deal with blanks when playing PPT slides
Mar 26, 2024 pm 07:51 PM
1. Open the PPT file you created and select the second slide. 2. On the second slide, select one of the pictures, and then select [Animation] to add any animation effect. 3. In the start column of the animation bar, change [While Standalone] to [After Previous Animation], and you will see that the picture animation label [1] will change to [0]. Do the same for subsequent slides, and you can see the effect by playing the slide at the end.
