Detailed explanation of iptraf command in Linux
iptraf is an IP LAN monitoring tool developed based on ncurses. It can monitor network card traffic in real time and generate various network statistics, including TCP information, UDP statistics, ICMP and OSPF information, Ethernet load information, and node statistics. , IP checksum errors and other information.
Different parameters added after iptraf can play different roles. The following is the parameter command list of iptraf:
Note: Open the command line window and use iptraf to be told that you need to run it as an administrator. To switch from an ordinary user to an administrator user, you only need to execute the command sudo su.
As shown in the figure below, Figure 1 is the prompt message before switching to the administrator identity, and Figure 2 is after switching to the administrator identity.


First, enter iptraf and the interface shown below will appear:
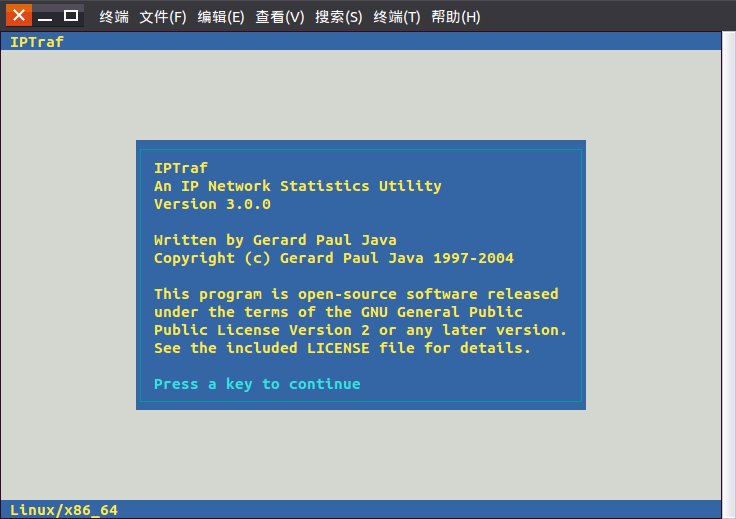
Click the "Enter" key to continue and enter the following picture:
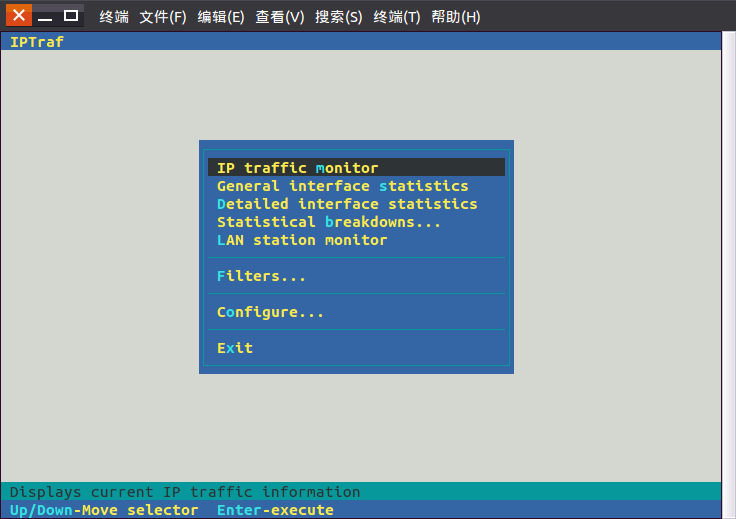
Click "Configure" menu in the total menu command to enter the following command menu:
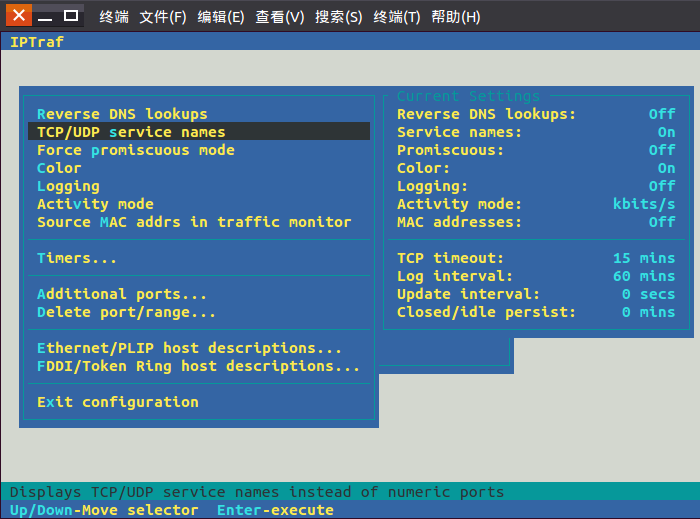
This is very important. Proper configuration can make the statistical results more intuitive and informative.
1) Reverse DNS lookups: View the domain name corresponding to the connected IP. You can see the domain name results in the pkt captured dialog box of the IP traffic monitor. This is not very intuitive, and it will affect the packet capture performance a little bit when turned on.
2) TCP/UDP service names: Wherever there is a port, the port number will be replaced with the corresponding service name, which is very useful and intuitive.
3) Activity mode: Displays whether the traffic is in Kbits/s or Kbytes/s. It is recommended to change it to the latter one to be more consistent with habits.
4) Additional ports: Monitor additional ports that need to be monitored by port number. By default, only ports less than 1024 are monitored.
This default is fine unless you have special needs.
Click "Filter" to enter the interface as shown below:
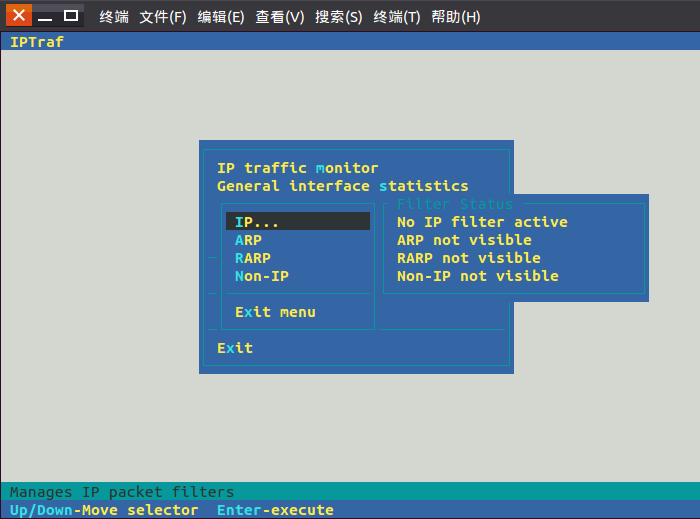
Check the network traffic based on the connection. It is best to let it run for a while to see the structure of the total statistics. If a single connection takes up a lot of bandwidth, it is easy to see. At the same time, based on the IP, you can easily tell whether you are interacting with an internal network or an external network server. pkt captured can see the mac address.
Click "IP traffic monitor" to enter the selection interface shown below,
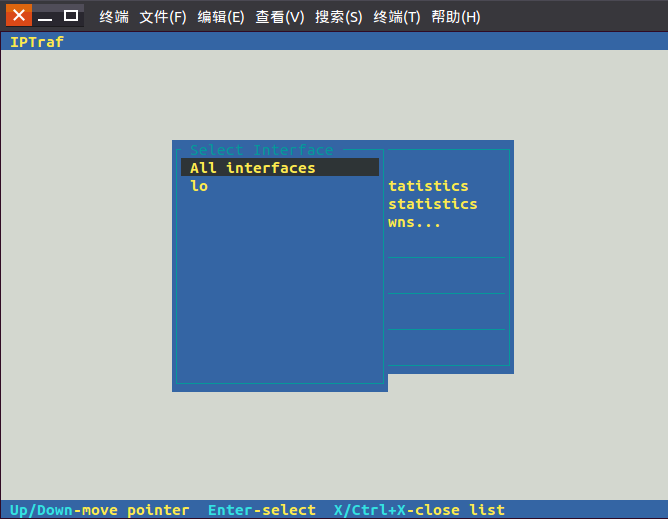
Click on the option to enter the view interface:
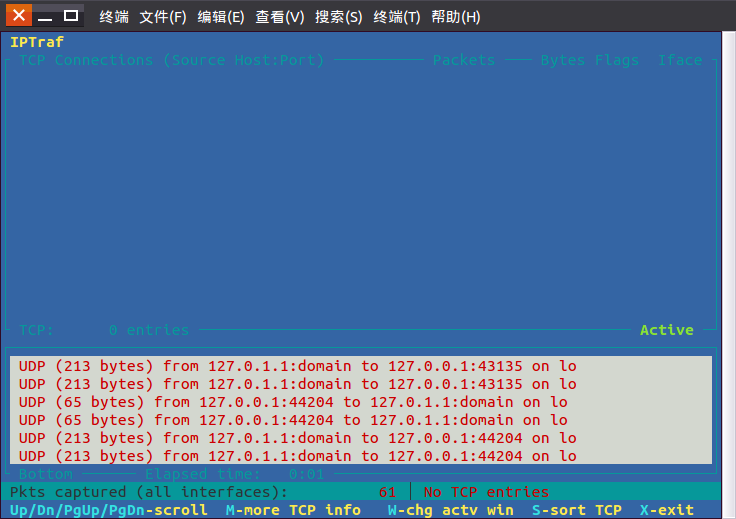
各ネットワーク カードのトラフィックを確認します。これは、内部ネットワークと外部ネットワークを含むネットワーク カードのトラフィックであることに注意してください。単一のマシンでは内部ネットワークと外部ネットワークを区別できません。
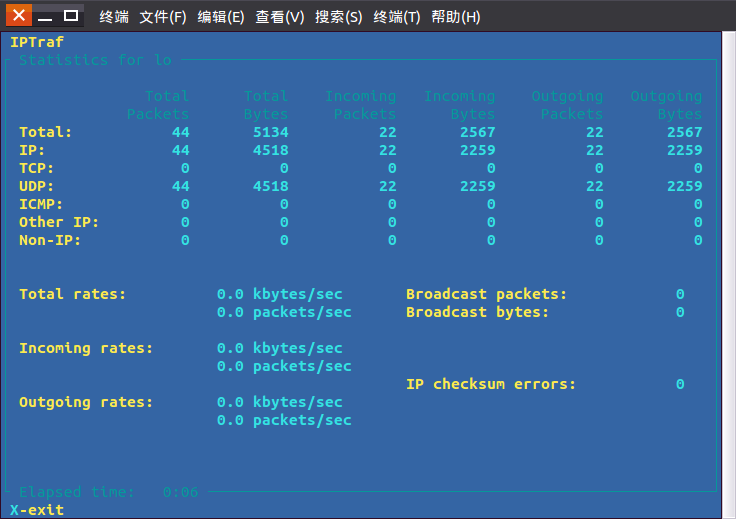
「一般インターフェイス統計」をクリックして、以下に示すインターフェイスに入ります:
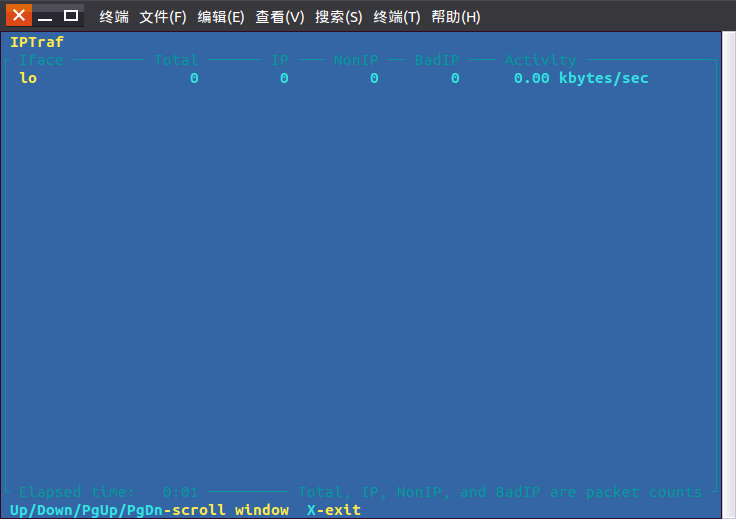
プロトコルの統計によると、IP、TCP、UDP などのプロトコルは少数しかなく、あまり役に立たないようです。
「詳細なインターフェース統計」をクリックして、以下に示す選択インターフェースに入ります。
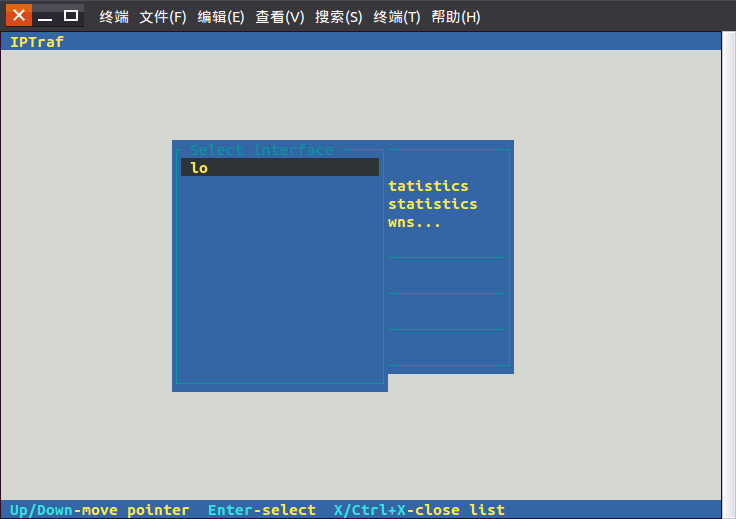
オプションをクリックしてビューインターフェイスに入ります:
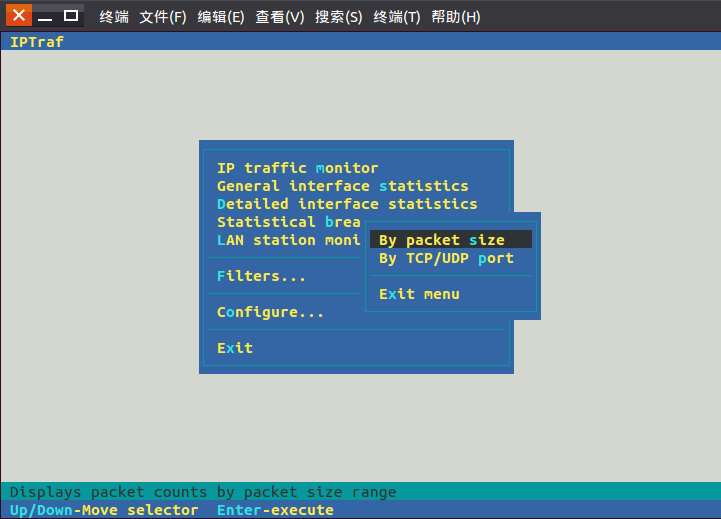
1) パケット サイズ別: 送信パケットのサイズに基づく統計。
2) TCP/UDP ポート別: アプリケーション プロトコルに基づく統計は、詳細なインターフェイス統計よりも実用的です。
「統計の内訳」をクリックしてオプションのメニューを表示します:
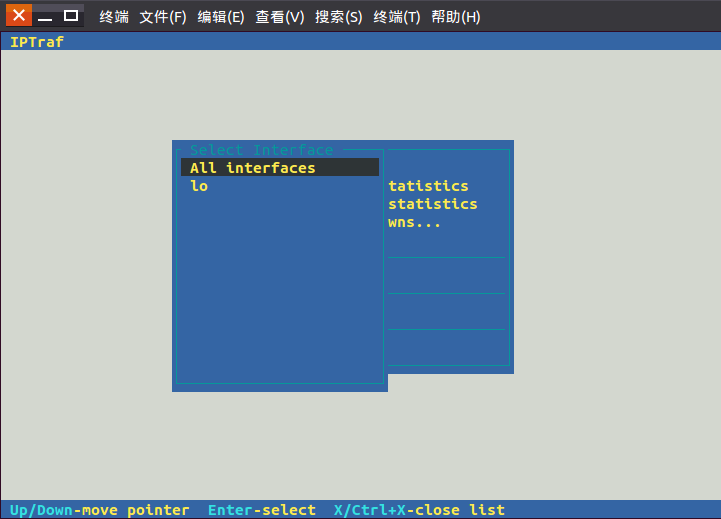
MAC アドレスの統計に基づいています。
「LANステーションモニター」をクリックするとオプションメニューが表示されます:
The above is the detailed content of Detailed explanation of iptraf command in Linux. For more information, please follow other related articles on the PHP Chinese website!

Hot AI Tools

Undresser.AI Undress
AI-powered app for creating realistic nude photos

AI Clothes Remover
Online AI tool for removing clothes from photos.

Undress AI Tool
Undress images for free

Clothoff.io
AI clothes remover

AI Hentai Generator
Generate AI Hentai for free.

Hot Article

Hot Tools

Notepad++7.3.1
Easy-to-use and free code editor

SublimeText3 Chinese version
Chinese version, very easy to use

Zend Studio 13.0.1
Powerful PHP integrated development environment

Dreamweaver CS6
Visual web development tools

SublimeText3 Mac version
God-level code editing software (SublimeText3)

Hot Topics
 deepseek web version entrance deepseek official website entrance
Feb 19, 2025 pm 04:54 PM
DeepSeek is a powerful intelligent search and analysis tool that provides two access methods: web version and official website. The web version is convenient and efficient, and can be used without installation; the official website provides comprehensive product information, download resources and support services. Whether individuals or corporate users, they can easily obtain and analyze massive data through DeepSeek to improve work efficiency, assist decision-making and promote innovation.
 How to install deepseek
Feb 19, 2025 pm 05:48 PM
There are many ways to install DeepSeek, including: compile from source (for experienced developers) using precompiled packages (for Windows users) using Docker containers (for most convenient, no need to worry about compatibility) No matter which method you choose, Please read the official documents carefully and prepare them fully to avoid unnecessary trouble.
 BITGet official website installation (2025 beginner's guide)
Feb 21, 2025 pm 08:42 PM
BITGet is a cryptocurrency exchange that provides a variety of trading services including spot trading, contract trading and derivatives. Founded in 2018, the exchange is headquartered in Singapore and is committed to providing users with a safe and reliable trading platform. BITGet offers a variety of trading pairs, including BTC/USDT, ETH/USDT and XRP/USDT. Additionally, the exchange has a reputation for security and liquidity and offers a variety of features such as premium order types, leveraged trading and 24/7 customer support.
 Ouyi okx installation package is directly included
Feb 21, 2025 pm 08:00 PM
Ouyi OKX, the world's leading digital asset exchange, has now launched an official installation package to provide a safe and convenient trading experience. The OKX installation package of Ouyi does not need to be accessed through a browser. It can directly install independent applications on the device, creating a stable and efficient trading platform for users. The installation process is simple and easy to understand. Users only need to download the latest version of the installation package and follow the prompts to complete the installation step by step.
 Get the gate.io installation package for free
Feb 21, 2025 pm 08:21 PM
Gate.io is a popular cryptocurrency exchange that users can use by downloading its installation package and installing it on their devices. The steps to obtain the installation package are as follows: Visit the official website of Gate.io, click "Download", select the corresponding operating system (Windows, Mac or Linux), and download the installation package to your computer. It is recommended to temporarily disable antivirus software or firewall during installation to ensure smooth installation. After completion, the user needs to create a Gate.io account to start using it.
 Ouyi Exchange Download Official Portal
Feb 21, 2025 pm 07:51 PM
Ouyi, also known as OKX, is a world-leading cryptocurrency trading platform. The article provides a download portal for Ouyi's official installation package, which facilitates users to install Ouyi client on different devices. This installation package supports Windows, Mac, Android and iOS systems. Users can choose the corresponding version to download according to their device type. After the installation is completed, users can register or log in to the Ouyi account, start trading cryptocurrencies and enjoy other services provided by the platform.
 gate.io official website registration installation package link
Feb 21, 2025 pm 08:15 PM
Gate.io is a highly acclaimed cryptocurrency trading platform known for its extensive token selection, low transaction fees and a user-friendly interface. With its advanced security features and excellent customer service, Gate.io provides traders with a reliable and convenient cryptocurrency trading environment. If you want to join Gate.io, please click the link provided to download the official registration installation package to start your cryptocurrency trading journey.
 How to Install phpMyAdmin with Nginx on Ubuntu?
Feb 07, 2025 am 11:12 AM
This tutorial guides you through installing and configuring Nginx and phpMyAdmin on an Ubuntu system, potentially alongside an existing Apache server. We'll cover setting up Nginx, resolving potential port conflicts with Apache, installing MariaDB (


