
 Technology peripherals
It Industry
3DMark Steal Nomad graphics card benchmark test postponed to achieve fairer cross-platform comparison
Technology peripherals
It Industry
3DMark Steal Nomad graphics card benchmark test postponed to achieve fairer cross-platform comparison
3DMark Steal Nomad graphics card benchmark test postponed to achieve fairer cross-platform comparison

According to responses from 3DMark developers on the Steam discussion forum, the latest graphics card benchmark Steal Nomad and its lightweight version Steel Nomad Light will be launched soon to achieve a fairer cross-platform comparison.

3DMark is a widely used benchmark software. UL Solutions released Steal Nomad in November last year. This test is designed to provide a general, non-ray tracing benchmark across multiple platforms representing launches in 2016. Among them, Time Spy is a very important test, providing a common performance baseline test for many platforms.
Unlike Time Spy, which is limited to DirectX 12 API, Steal Nomad can also be used on macOS, Android, and Linux platforms:
Use Metal API on macOS
Using Vulcan API on Android, Linux
The developer said that unlike the game, after the benchmark was released, it It would be inappropriate to make corrections that affect test scores, so Steal Nomad needs to be launched with enough care to ensure it stands the test of time.
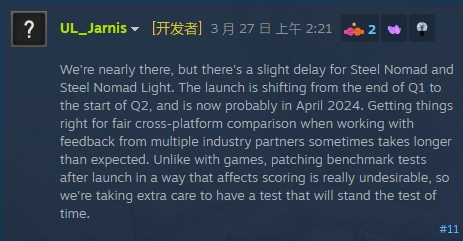
is expected to be released in April .
The above is the detailed content of 3DMark Steal Nomad graphics card benchmark test postponed to achieve fairer cross-platform comparison. For more information, please follow other related articles on the PHP Chinese website!

Hot AI Tools

Undresser.AI Undress
AI-powered app for creating realistic nude photos

AI Clothes Remover
Online AI tool for removing clothes from photos.

Undress AI Tool
Undress images for free

Clothoff.io
AI clothes remover

AI Hentai Generator
Generate AI Hentai for free.

Hot Article
Hot Tools

Notepad++7.3.1
Easy-to-use and free code editor

SublimeText3 Chinese version
Chinese version, very easy to use

Zend Studio 13.0.1
Powerful PHP integrated development environment

Dreamweaver CS6
Visual web development tools

SublimeText3 Mac version
God-level code editing software (SublimeText3)
Hot Topics


 How does 3dmark test the graphics card pass rate - what is the difference between free and paid 3dmark?
Mar 18, 2024 pm 12:04 PM
How does 3dmark test the graphics card pass rate - what is the difference between free and paid 3dmark?
Mar 18, 2024 pm 12:04 PM
3Dmark is a software developed by Futuremark Company specifically for measuring the performance of graphics cards. It has now tended to test overall consoles, but it is still dominated by graphics card testing and running scores. However, many friends may have downloaded it but have little idea of how to use it. Next, let me introduce to you how 3dmark measures the graphics card pass rate and the difference between free and paid 3dmark. 1. How to measure the graphics card pass rate with 3dmark. The first step is to download 3DMark After the installation is complete, open 3DMark. The second step is to select the target object of the test you want to run. Here is an analysis. TimeSpy is usually used to test DirectX12 performance, while NightRaid is used to test low-end devices and integrated graphics cards.
 iPad Air 5 benchmarks show same performance as 11-inch iPad Pro
May 18, 2023 am 10:34 AM
iPad Air 5 benchmarks show same performance as 11-inch iPad Pro
May 18, 2023 am 10:34 AM
As expected, since both devices use the M1 processor, early benchmarks show the iPad Air 5 scoring the same as the 11-inch iPad Pro. The reviewer ran the iPad Air 5 through Geekbench, and the scores weren't surprising. In fact, the numbers only differ due to rounding errors and variations from run to run. The iPad Air 5 is listed as "iPad 13,17" in Geekbench, showing a single-core score of 1,711 and a multi-core score of 7,233 in a CPU test. This is similar to the 11-inch iPad Pro, which has a single-core score of 1718 and a multi-core score of 7313. exist
 Apple's Snapdragon 8 Gen 3 vs. A17 Pro: Both have ray tracing, but which one is better?
Oct 25, 2023 am 11:17 AM
Apple's Snapdragon 8 Gen 3 vs. A17 Pro: Both have ray tracing, but which one is better?
Oct 25, 2023 am 11:17 AM
Still buzzing about Qualcomm’s exclusive scoop on the upcoming Snapdragon 8 Gen 3? Well, here's how the Snapdragon 8 Gen 3 vs A17 Pro compares: Both powerful chips come with ray tracing support, but which one will best suit your needs? Apple is proud that its latest chip will power games like Resident Evil 2 Remake and Resident Evil 7 once ported to iOS, but Qualcomm's new AI marvel does have its very own ray tracing support . "Advanced camera and audio technologies enable crystal-clear video and crystal-clear audio. Powerful AI-accelerated experiences and enterprise-grade security enable modern mobile PCs," the company said in an official statement ahead of today's Snapdragon Summit event
 LLM ultra-long context query-practical performance evaluation
Apr 03, 2024 am 11:55 AM
LLM ultra-long context query-practical performance evaluation
Apr 03, 2024 am 11:55 AM
In the application of large language models (LLM), there are several scenarios that require data to be presented in a structured manner, of which information extraction and query analysis are two typical examples. We recently emphasized the importance of information extraction with updated documentation and a dedicated code repository. For query analysis, we have also updated relevant documentation. In these scenarios, data fields may include strings, Boolean values, integers, etc. Among these types, dealing with high cardinality categorical values (i.e. enumeration types) is the most challenging. The so-called "high cardinality grouping values" in the picture refer to those values that must be selected from a limited number of options. These values cannot be specified arbitrarily, but must come from a predefined set. In such a set, sometimes there will be a very large number of valid values
 What software is 3dmark-how to use 3dmark?
Mar 18, 2024 pm 12:37 PM
What software is 3dmark-how to use 3dmark?
Mar 18, 2024 pm 12:37 PM
3dmark is a software developed by Futuremark Company specifically for measuring the performance of graphics cards. It can also be used as an indicator to measure the performance of a computer. So what software is 3dmark? How to use 3dmark? Let the editor explain it to you next. 1. What software is 3dmark? The origin of the software 3Dmark is a software from Futuremark Company specially designed to measure the performance of graphics cards. It has been tended to test the overall host, but it is still Mainly based on graphics card testing and running scores. As a paid software, 3Dmark can be downloaded online, and the genuine version can be purchased on steam. In the early days of graphics card acceleration, the market did not yet have as many 3D games as there are today.
 Nvidia RTX 4070 Super graphics card 3DMark test results announced, performance improved by about 18% compared to RTX 4070
Jan 16, 2024 pm 10:30 PM
Nvidia RTX 4070 Super graphics card 3DMark test results announced, performance improved by about 18% compared to RTX 4070
Jan 16, 2024 pm 10:30 PM
According to news from this site on January 16, the RTX4070Super graphics card is equipped with a 7168CUDA core and 12GB21Gbps192bitGDDR6X memory. The TGP reaches 220W. It is said that it only requires about 200W when playing and only 11W when idle. Its performance exceeds that of the RTX3090. The National Bank is priced at 4899 yuan. VideoCardz has now exposed the 3DMark running score of the Nvidia RTX4070Super graphics card. The data shows that this graphics card with 7168 CUDA core has improved by about 18% compared to the 5888 core RTX4070, and is only 5~8% behind the more expensive RTX4070Ti. According to HardareLuxx media editor Andrea
 3DMark Steal Nomad graphics card benchmark test postponed to achieve fairer cross-platform comparison
Apr 02, 2024 am 08:58 AM
3DMark Steal Nomad graphics card benchmark test postponed to achieve fairer cross-platform comparison
Apr 02, 2024 am 08:58 AM
According to responses from 3DMark developers on the Steam discussion forum, the latest graphics card benchmark StealNomad and its lightweight version SteelNomadLight will be launched soon to achieve a fairer cross-platform comparison. ▲Screenshot of SteelNomad. Image source ULSolutions3DMark is a widely used benchmark software. ULSolutions released StealNomad in November last year. This test is designed to provide a general, non-ray tracing benchmark across multiple platforms representing launches in 2016. Among them, TimeSpy is a very important test, providing a common performance baseline test for many platforms. Unlike being limited to DirectX
 Benchmarks and performance comparison in Go language
May 08, 2024 am 09:27 AM
Benchmarks and performance comparison in Go language
May 08, 2024 am 09:27 AM
In the Go language, you can easily write benchmarks to measure code performance by using the BenchmarkXXX functions in the testing package. These functions follow the standard syntax and receive a pointer of type *testing.B as parameter, which is used to control the running of the benchmark. Running the benchmark (gotest-bench=BenchmarkName) can output a table of results showing various information such as the number of nanoseconds spent on each operation, the number of operations performed per second, the number of iterations run in the test and the number of times passed per second. Amount of memory, etc. By comparing the results of different benchmarks, you can identify inefficient code areas and thereby improve the overall performance of your application.
