
 web3.0
Analyzing the surge in Bitcoin market liquidity: analyzing market conditions from the perspective of long-term and short-term holder behavior
web3.0
Analyzing the surge in Bitcoin market liquidity: analyzing market conditions from the perspective of long-term and short-term holder behavior
Analyzing the surge in Bitcoin market liquidity: analyzing market conditions from the perspective of long-term and short-term holder behavior

The price of Bitcoin broke through the all-time high (ATH) at $73,750.07 on March 14, becoming an important turning point in the current market and also marking the entry of Bitcoin price into a new unknown area, that is, "price discovery" stage. Michael Novogratz, founder and CEO of Galaxy Digital, said that the current market has attracted many new investors.
Market Liquidity Rising
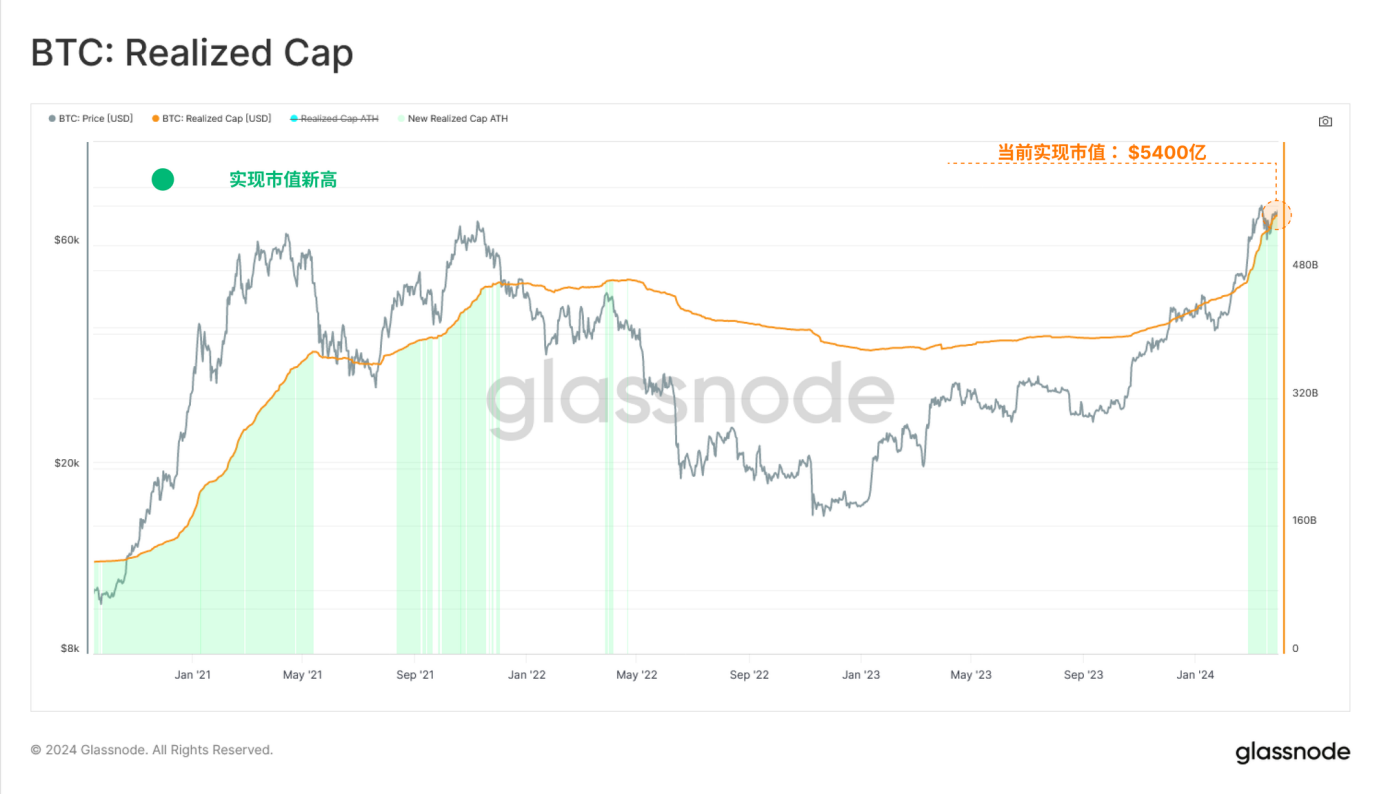
Glassnode recently wrote that at this stage, market prices have prompted a large amount of supply to be used for cash out and profit, which has led to the revaluation of sold Bitcoins, usually From a lower cost to a higher cost. That is, when these Bitcoins change hands, we can also think of it as an injection of new demand and liquidity into the asset class. This mechanism is highlighted by the implementation of the market capitalization indicator, which tracks the accumulated dollar liquidity "stored" in the asset class. The current realized market capitalization has now reached a new all-time high of $540 billion and is growing at an unprecedented rate of more than $79 billion per month.
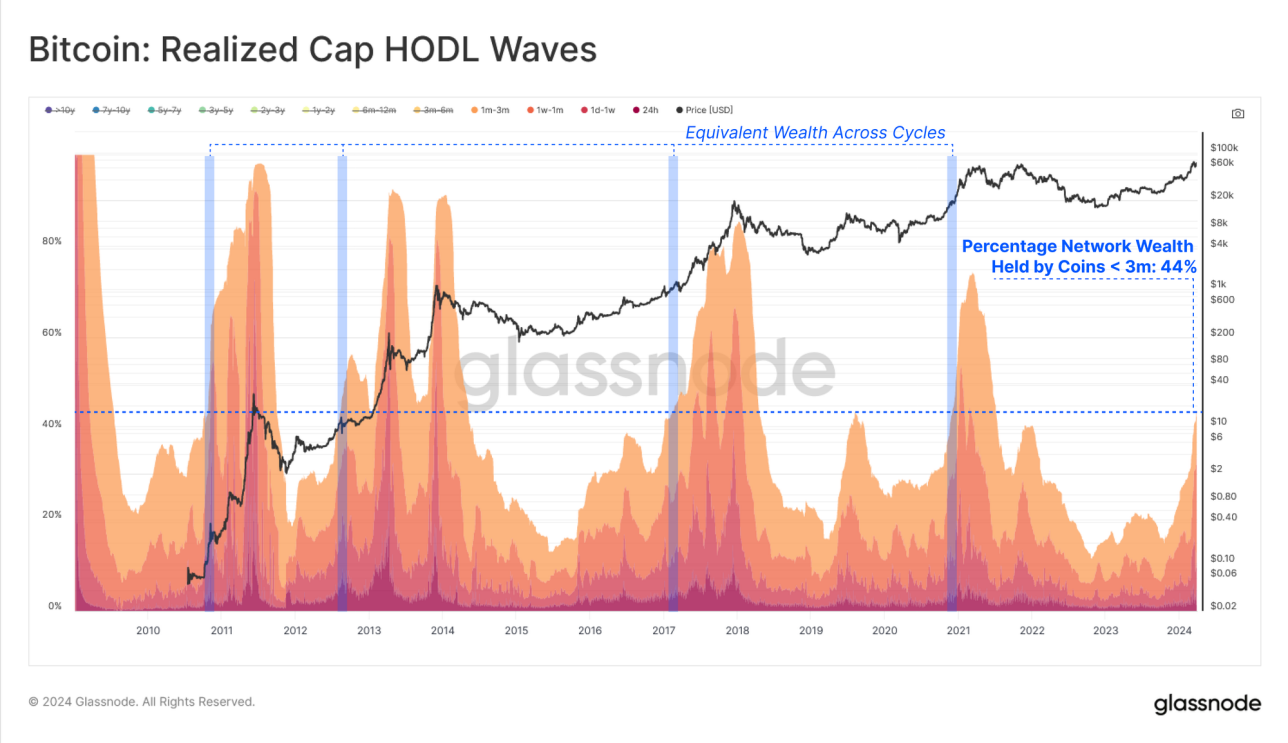
If we only consider holders who have held the currency for no more than 3 months, we can see that the number has increased sharply in recent months, which means that in recent months New investors to the Bitcoin market (those who have bought and held Bitcoin for no more than three months) now control approximately 44% of the total Bitcoin share. The increase in this ratio directly reflects long-term holders selling their Bitcoins when Bitcoin prices are higher to meet new demand fluctuations in the market. It also illustrates the changes in the distribution of wealth in the Bitcoin market and the significant growth of new investors’ share of the total wealth in the Bitcoin network.
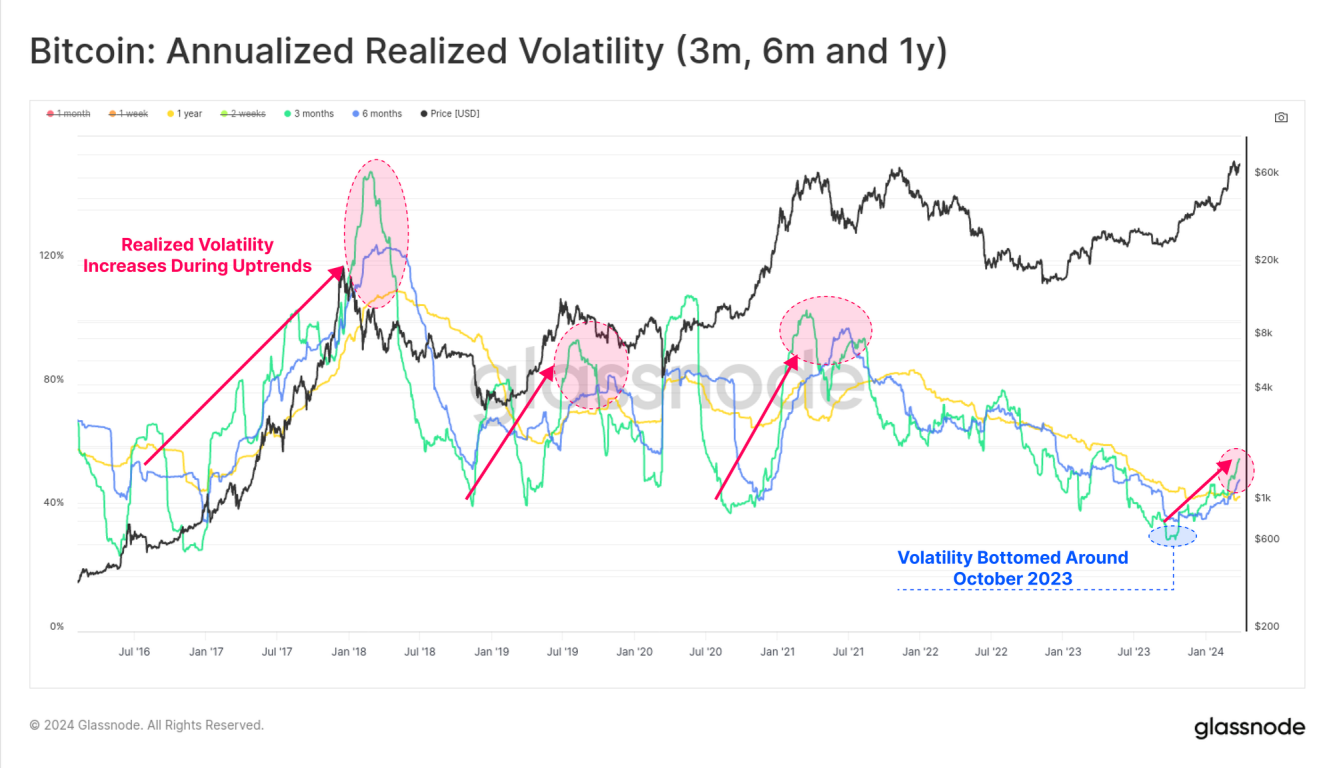
In the past Bitcoin cycle, the injection of new demand into the market usually revealed traders’ heightened interest in speculation and often caused greater market volatility. This was the case in the past for Bitcoin. Characteristics of macro-uptrends in currency cycles.
Since volatility bottomed out in October 2023 (bottom right of chart below), 90-day realized volatility has nearly doubled from 28% to 55%, a period that highlights the realization of market capitalization inflows Growth begins to accelerate.
The market is beginning to recover
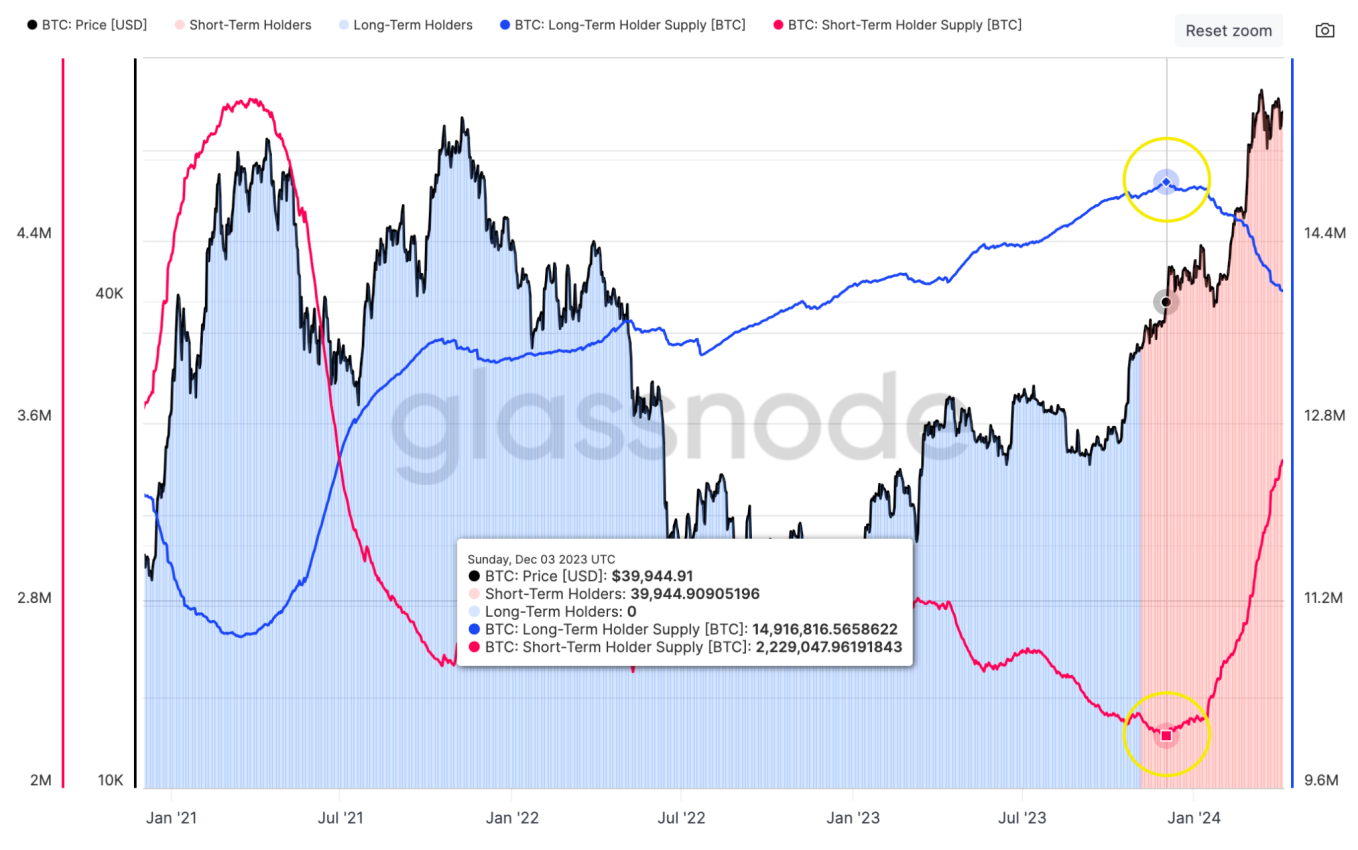
After the historic tightening of supply last year (see the yellow area on the chart below), long-term holders (blue line) and short-term holders There is a strong divergence between the supply of holders (red line), with the supply of long-term holders near an all-time high, while the supply of short-term holders is actually at an all-time low, highlighting the increasing tightening of BTC supply.
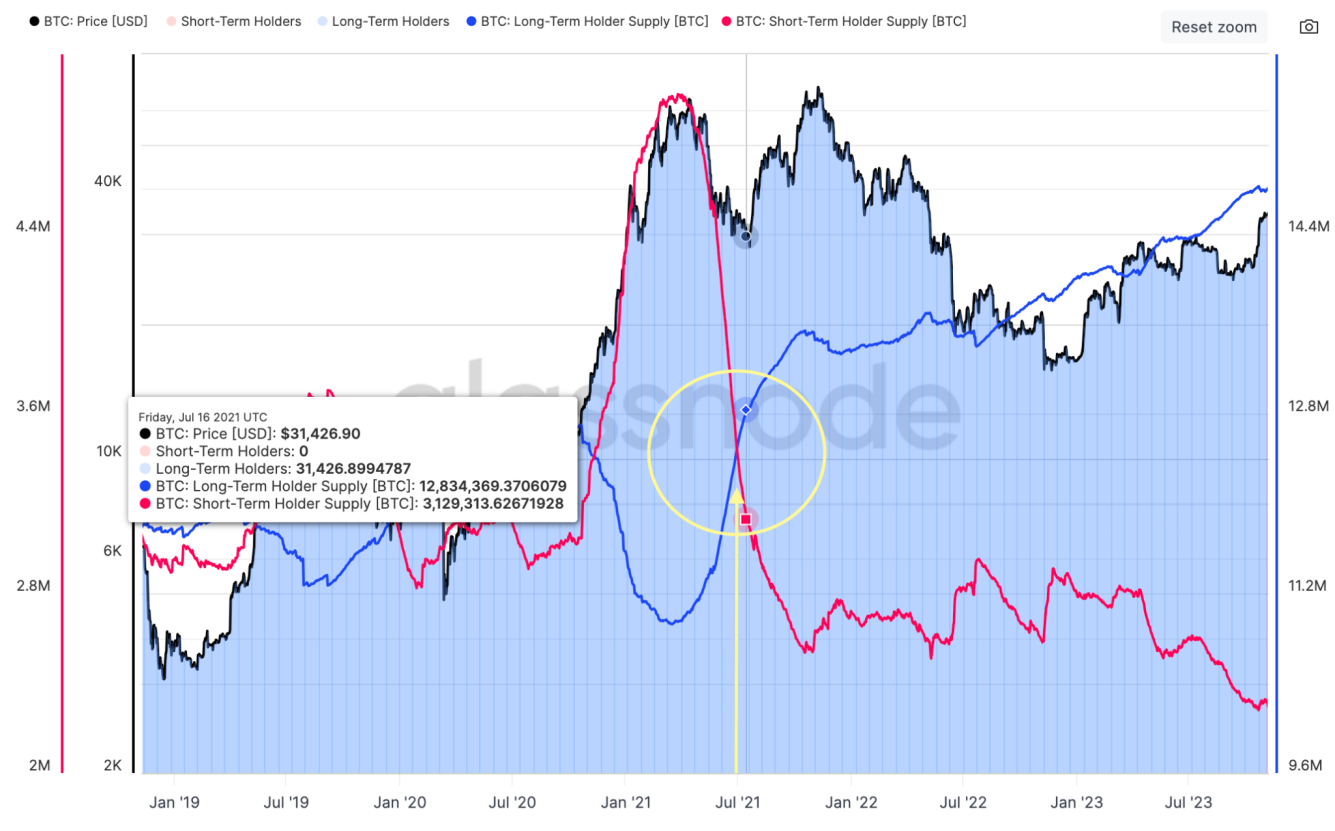
#The supply difference between long-term holders and short-term holders has begun to narrow today. As prices rise, investors hold more unrealized profits, which in turn entices long-term holders to sell their positions.
Glassnode data shows that since reaching a peak of 14.916 million BTC in December 2023, the supply to long-term holders has decreased by 900,000 BTC, indicating an important market shift. Among them, the proportion of GBTC outflows accounts for about one-third of this number (about -286,000 BTC).
PANews believes that this part of the outflow reflects a large outflow of funds from GBTC, which may cause long-term holders to increase market supply, especially when they choose to exchange their GBTC holdings for Bitcoin or cash. . This partly explains why there has been a significant reduction in long-term holder supply, partly due to outflows from GBTC.
Relatively, the supply of short-term holders increased by 1.121 million BTC, absorbing the selling pressure from long-term holders, and obtained an additional 121,000 BTC from the secondary market through exchanges . This change in supply and demand dynamics highlights shifts in market structure and the impact of different types of investor behavior on Bitcoin supply and price.
Based on the above information, it can be concluded that when the market reaches a new high, the behavior pattern of investors has obviously changed. As new demand builds, the pressure on long-term holders to sell at higher prices appears to be accelerating. While newly approved ETFs become an important new element in the market structure, these trends have been reflected in on-chain data for all previous cycles.
Then Glassnode further analyzed the holding situation of Bitcoin prices exceeding 60,000 US dollars. From the figure below, we can see that there are approximately 1.875 million Bitcoins, accounting for 9.5% of the current circulation, all when the price exceeds Purchased for $60,000.
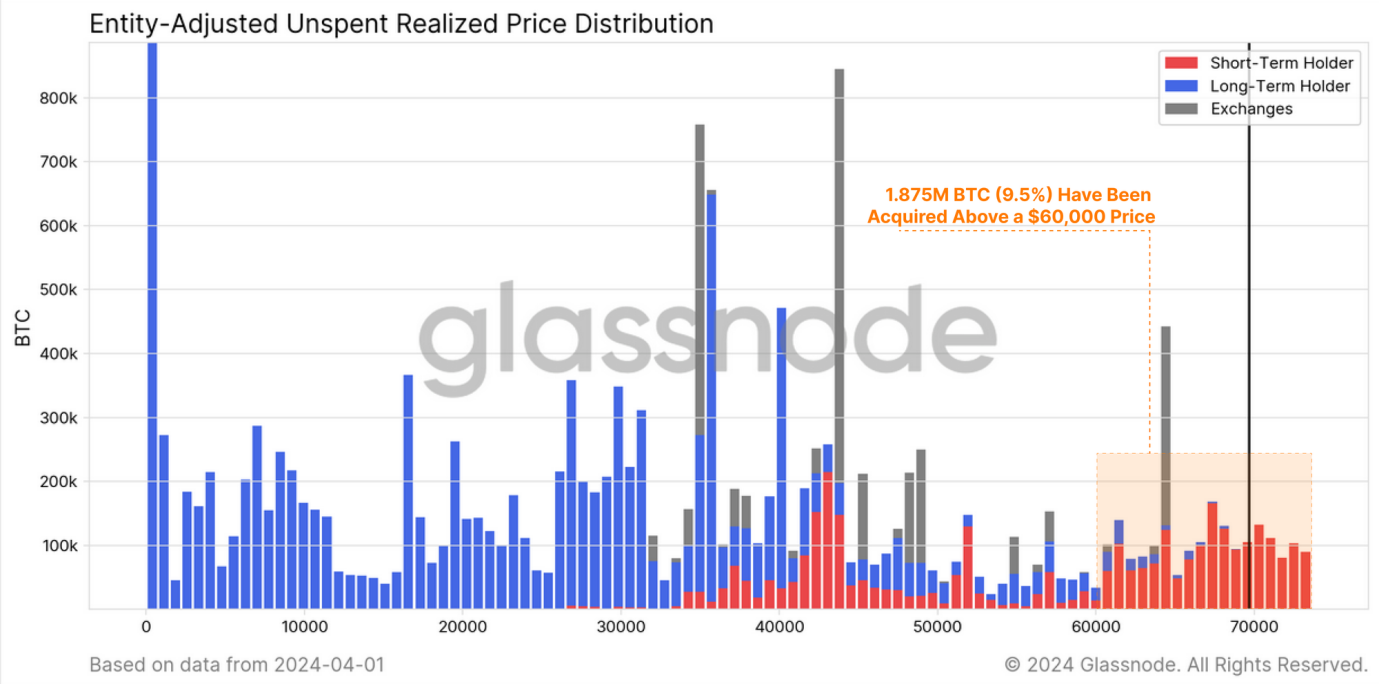
And as pointed out by the red ratio, most Bitcoins are currently controlled by short-term holders, which shows that a considerable part of Bitcoins have been purchased at high prices in the near future. Additionally, approximately 508,000 Bitcoins are held in U.S. spot ETFs (excluding GBTC), which is also attributed to short-term holders, as ETF investors typically seek short-term profits rather than long-term holdings.
We can also correspond to the activity indicator in the figure below. Activity is an indicator that measures the overall balance of "holding time" in the Bitcoin supply. If activity continues to rise (orange line), it means that the number of Bitcoins being sold in the market (especially those that have been inactive for a long time) exceeds the number of new Bitcoins being purchased and held for the long term. This trend suggests that, overall, more Bitcoin in the market is being used for profit rather than being held for the long term (HODL).
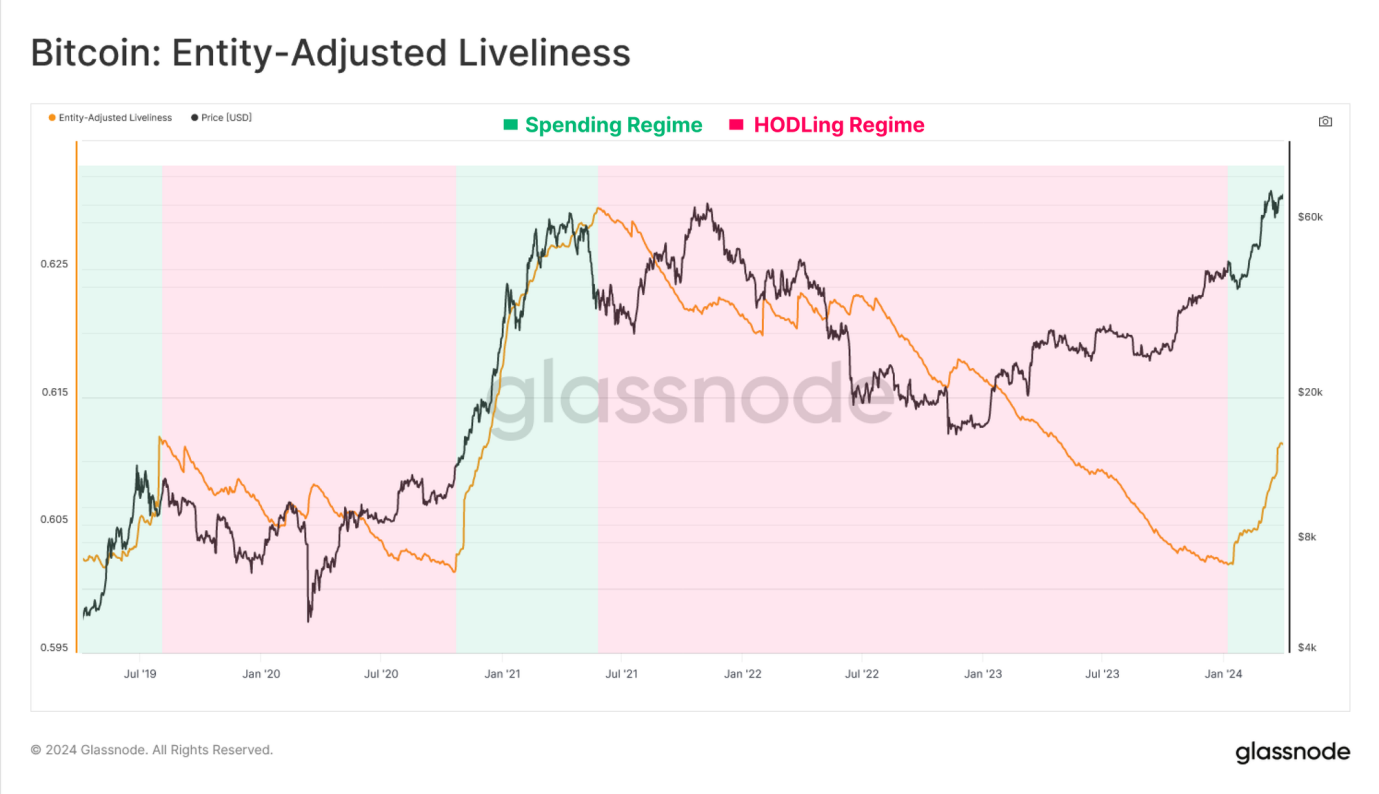
Taken together, the current state of the market quickly leads to the conclusion that the Bitcoin market has transformed into a stage mainly focused on selling and profit-making. PANews believes that this shift reflects the increase in short-term holders in the market and changes in Bitcoin trading behavior, especially when prices are high. This change in behavioral patterns is critical to understanding both short-term and long-term trends in the Bitcoin market. .
Indicators dismantle the market behavior of long-term holders and short-term holders
In the process of finding the balance between supply and demand, understanding the behavior of long-term holders and short-term holders is crucial to capturing the market Trends are also important. Based on the on-chain indicators provided by Glassnode, readers will be led to explore how to analyze the application and value of the market through several indicators.
The first is the "realized profit and loss ratio". This indicator is mainly used to find market turning points. That is to say, the realized profit and loss ratio fluctuates around the equilibrium value of 1 on the nonlinear measurement scale, which can provide us with Ideal tool for spotting market turning points. Particularly in an uptrend, when realized losses increase sharply, this may indicate that those buyers who bought at the top are beginning to panic sell, suggesting that the market may be reaching a turning point.
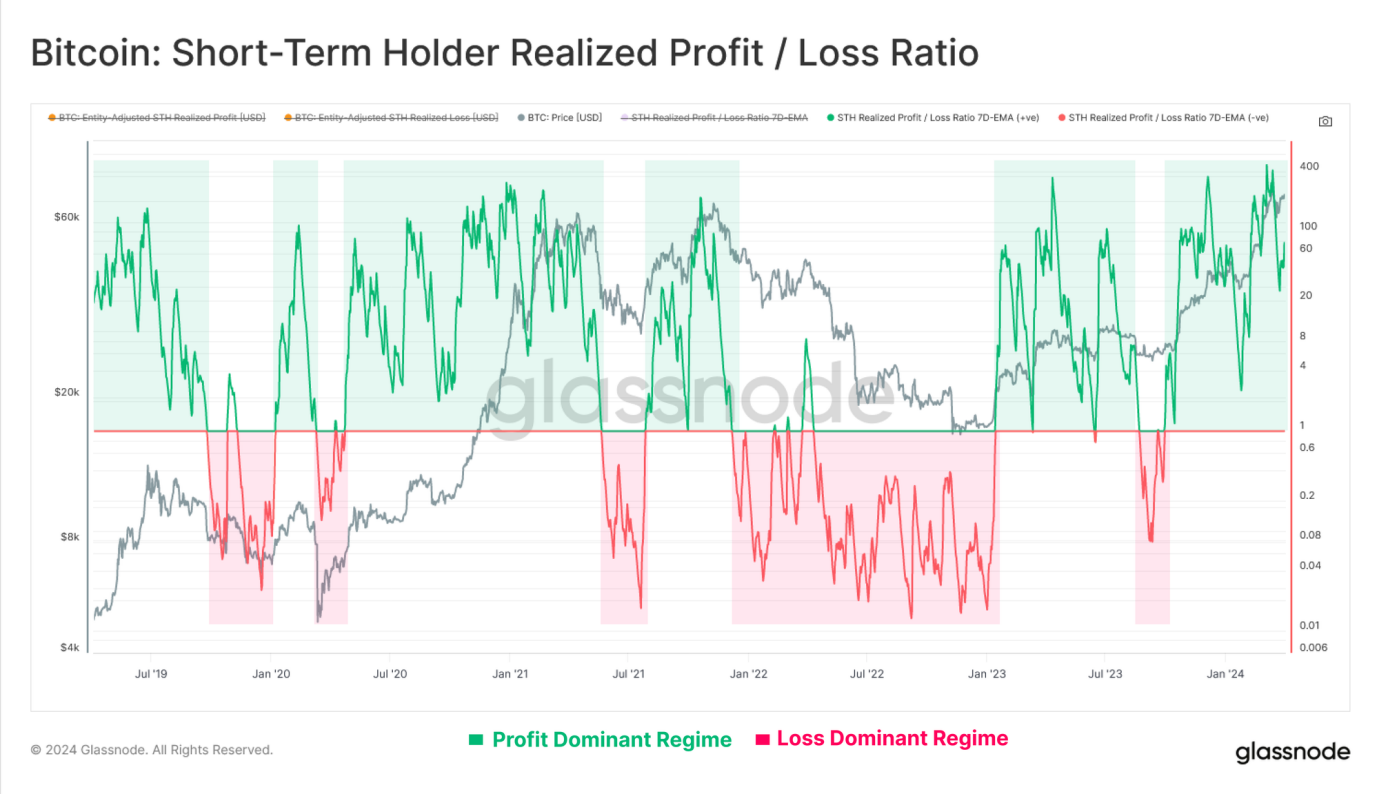
We start with the analysis of short-term holders, and we can see that their profit-loss ratio remains within a profit-dominated range, which means that their profits are approximately equal to losses. 50 times. This profit-to-loss ratio bounces back and forth from an equilibrium level of 1.0, showing that investors are generally able to absorb profits when market prices correct, and maintain their investment costs and avoid losses when prices fall.
Simply put, when this ratio is above 1, it means that the profit gained by short-term holders from selling Bitcoin is greater than the loss. If the ratio is high, say much more than 1, it means that there are many more people making money in the market than losing money.
In the above picture, the green area shows that profits are dominant, while the red area represents that losses are more significant. Generally speaking, when the price of Bitcoin goes through an upward trend and then pulls back, if this ratio can remain above 1, this is usually regarded as a sign of market health, indicating that even in the face of price fluctuations, most people are still making profits. status.
To gain a deeper understanding, we can compare this profit-loss ratio with the market price trend of Bitcoin to observe market sentiment and possible price changes. For example, if the price of Bitcoin hits new highs and the profit-to-loss ratio falls at the same time, this could signal an imminent market correction. Conversely, if prices fall and the profit-to-loss ratio rises, it could be a sign that the market is about to rebound.
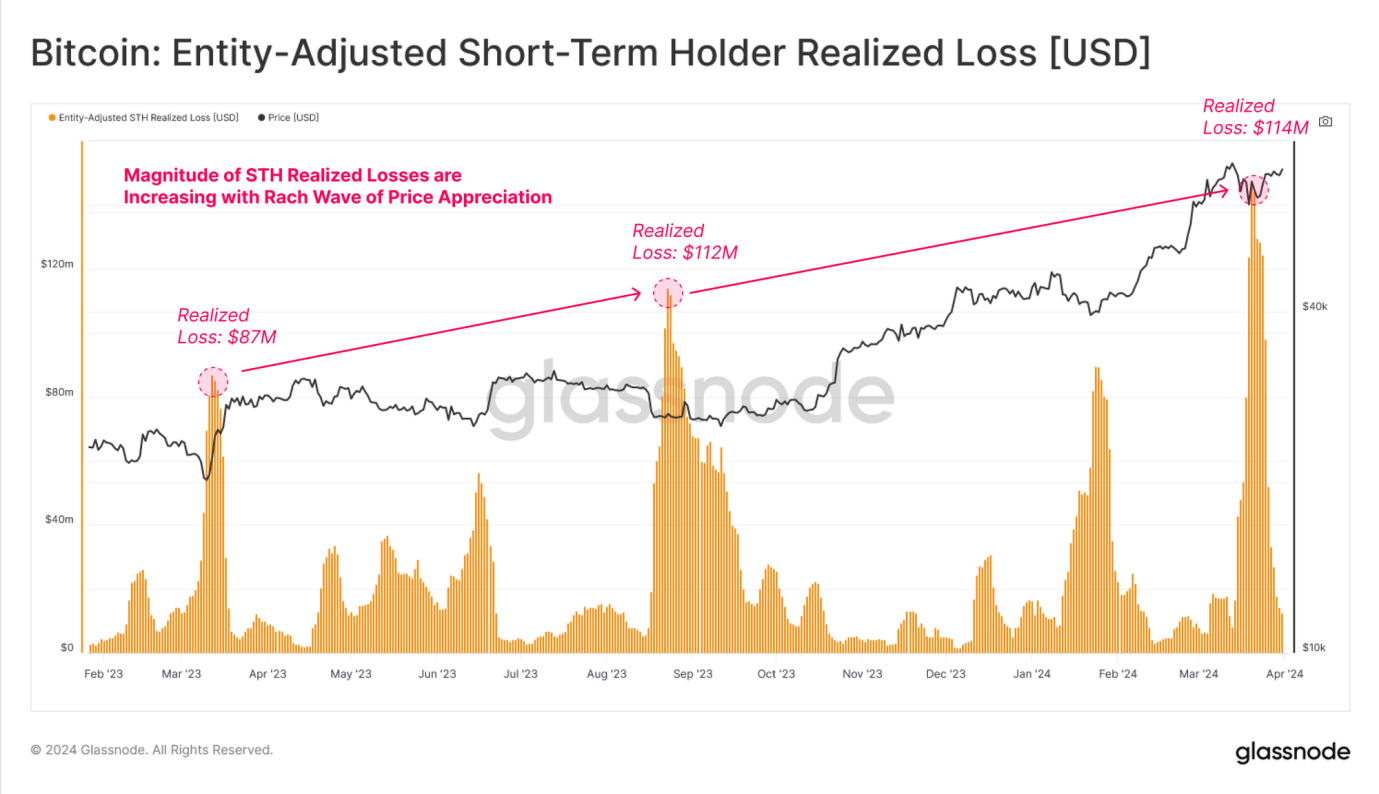
As we can see from the chart below, during the market price correction period, the losses realized by short-term holders have a clear peak. We can speculate that the market will buy in the near future in anticipation of further price declines. Investors in Bitcoin rush to sell to avoid greater losses (panic selling).
And after each market adjustment, the realized loss has increased. This suggests that the number and size of "top buyers" attracted by each wave of price increases increases.
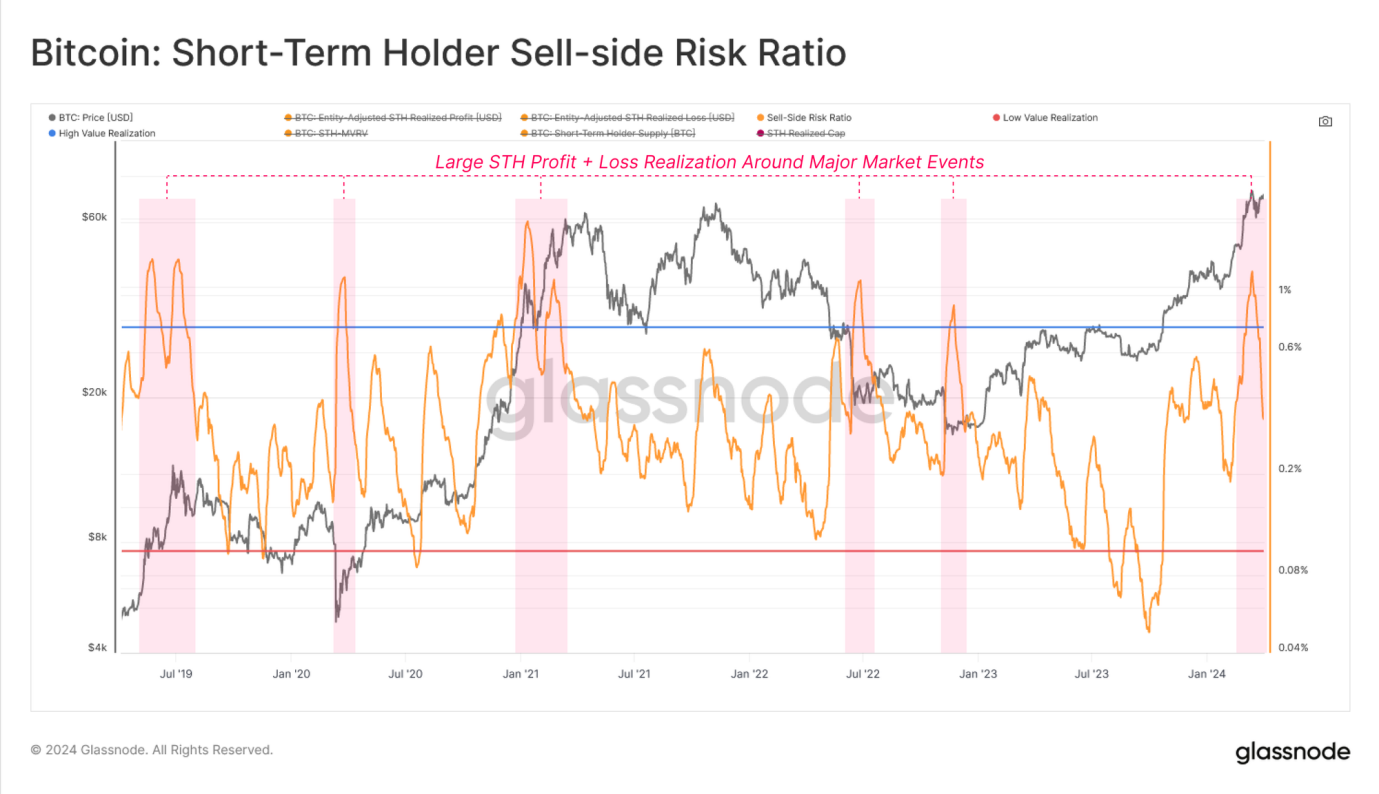
Then there is the "Seller Risk Ratio" indicator, which is mainly used to evaluate the relative size of its profit and loss events. This indicator can help understand the moving power of the market and its impact on the overall market. The impact of scale, especially when the market is at or near new all-time highs.
High values indicate that short-term holders are buying and selling cryptocurrencies at prices well above or below their cost basis, meaning the market may need to re-find its balance (often accompanied by wild price swings). Conversely, low values indicate that the majority of Bitcoin being sold is close to its breakeven cost basis, suggesting that the market has reached some level of equilibrium and that “breakeven” has been exhausted within the current price range (usually when describing a low volatility sexual environment).
After the price of Bitcoin exceeded $70,000, the short-term holder selling risk ratio increased significantly, which usually occurs near market turning points (both overall and local). It also usually indicates that a new balance has not yet been formed, and the indicator is correcting sharply as the market adjusts and consolidates.
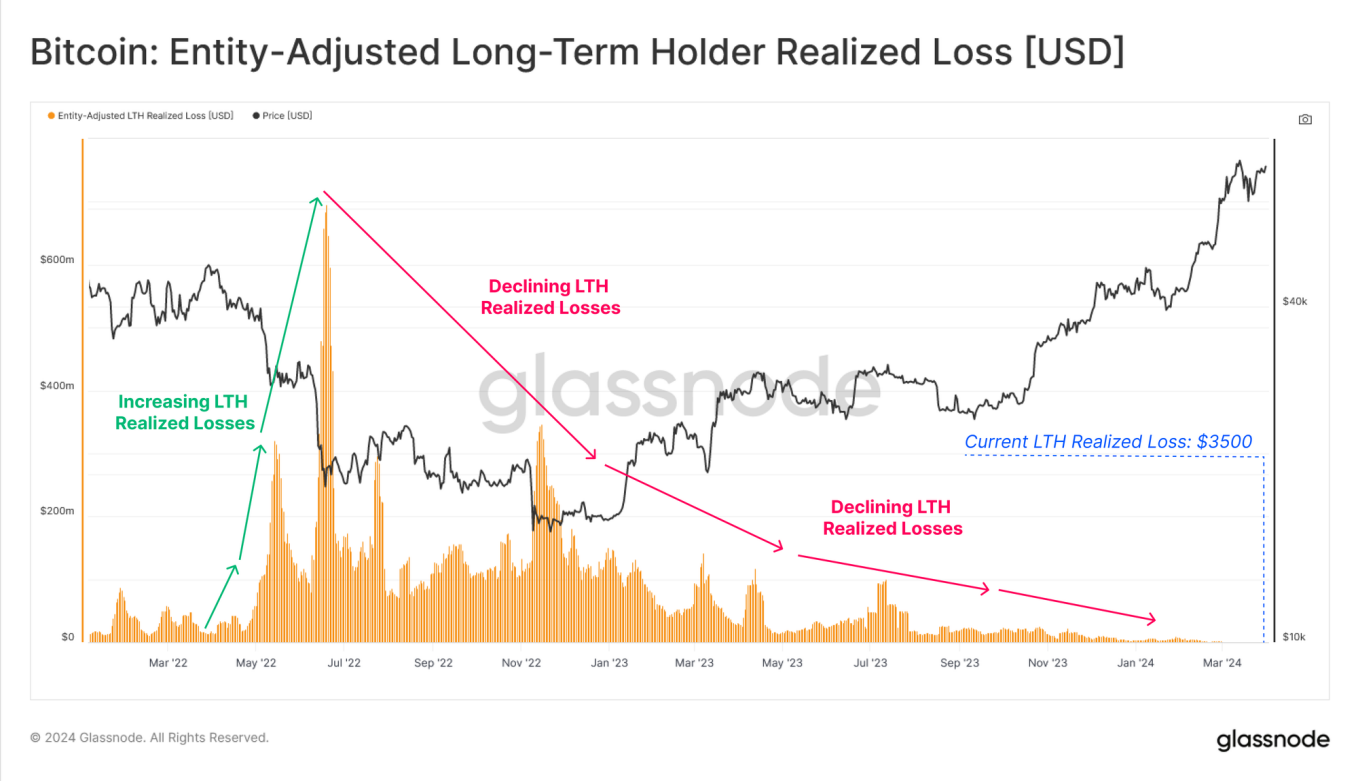
In an evaluation of long-term holders, you can see in the chart below that their realized profit/loss ratio has increased exponentially and vertically. By definition, this is because there were no long-term holders in the losses when the market had just broken out of the previous cycle's top, which was further fueled by the aforementioned increase in profit-taking by long-term holders.

While we can track the realized losses of short-term holders in an uptrend, it is more important to monitor the realized profits of long-term holders because this is selling A key component of stress. PANews believes that the behavior of long-term holders is often viewed as a long-term indicator of market health. When their realized losses are low, it suggests they are in no rush to sell when prices fall, which may mean they are optimistic about the market's long-term outlook. Looking at the behavior of short-term holders, high realized losses reflect market volatility and investor panic.
To illustrate this point, we can see that in the recent correction, long-term holders’ realized losses have been reduced to just $3,500 per day compared to $114 million for short-term holders.
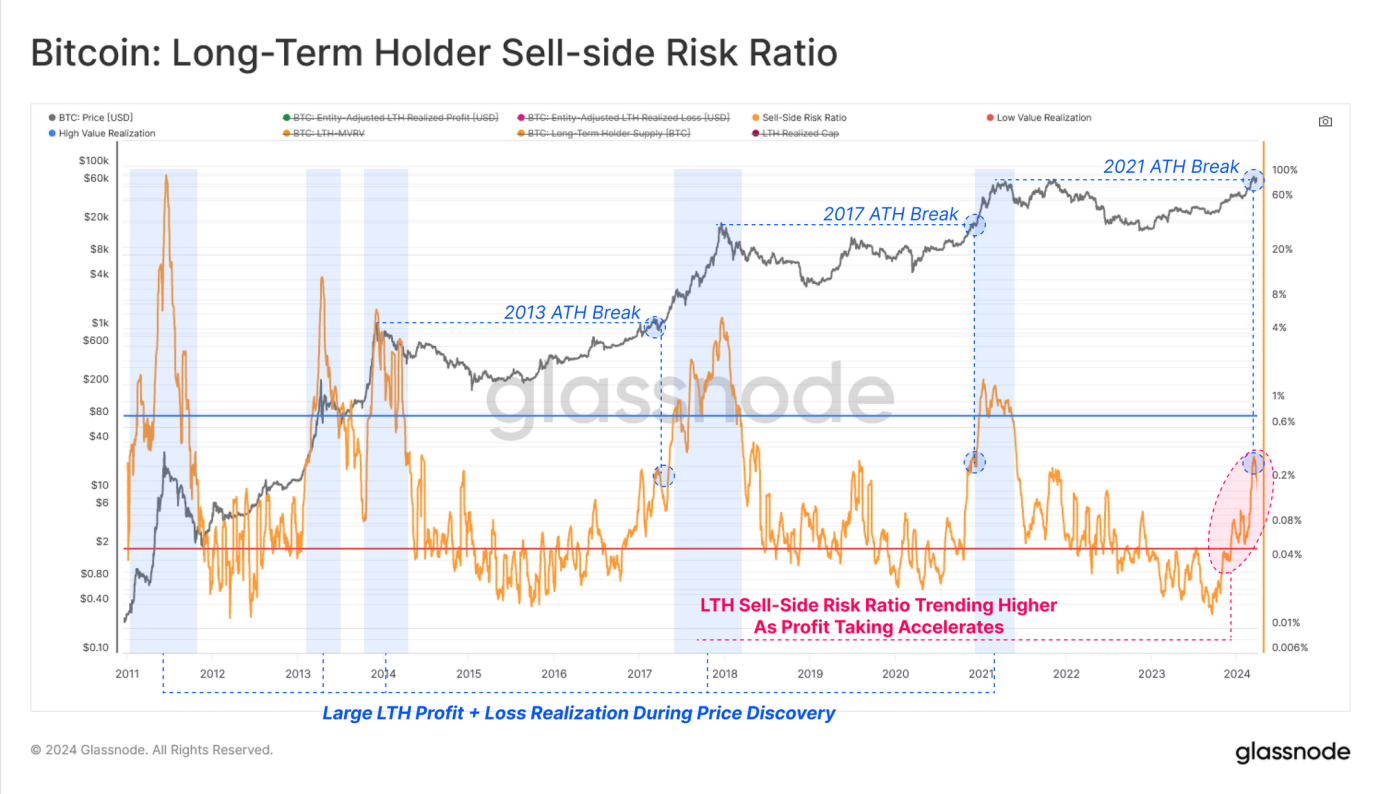
Finally, Glassnode noted an acceleration in profits realized by long-term holders, resulting in an upward trend in their sell-side risk ratios since October 2023. The good growth in this indicator along with the all-time high breakout suggests that allocation pressure and profit-taking among the long-term holder group is similar on a relative basis to previous cycles.
In short, by analyzing the combination of long-term holders and short-term holder groups, as well as their profit and loss behavior, it provides a variety of investor psychology and capital flows. perspective.
Through Glassnode’s various on-chain tools and indicators, we can also observe that the current investor behavior pattern in the Bitcoin market is changing significantly. Long-term holders have been deep into their selling cycles, realizing profits and awakening dormant supply to meet new demand at higher prices. Then using the analysis of different holders on the chain, we can use these indicators to identify turning points in local and global markets, especially using profit and loss indicators.
Finally, the combination of long-term and short-term holder groups, and their profit and loss behavior, also indicates potential shifts in market trends. Changes in these behavioral patterns, especially profit realization and loss taking at key price points, provide a new way to predict market fluctuations and top opportunities.
By comprehensively considering the above indicators, we can understand the market dynamics more comprehensively and make more careful plans for future investment strategies.
The above is the detailed content of Analyzing the surge in Bitcoin market liquidity: analyzing market conditions from the perspective of long-term and short-term holder behavior. For more information, please follow other related articles on the PHP Chinese website!

Hot AI Tools

Undresser.AI Undress
AI-powered app for creating realistic nude photos

AI Clothes Remover
Online AI tool for removing clothes from photos.

Undress AI Tool
Undress images for free

Clothoff.io
AI clothes remover

AI Hentai Generator
Generate AI Hentai for free.

Hot Article
Hot Tools

Notepad++7.3.1
Easy-to-use and free code editor

SublimeText3 Chinese version
Chinese version, very easy to use

Zend Studio 13.0.1
Powerful PHP integrated development environment

Dreamweaver CS6
Visual web development tools

SublimeText3 Mac version
God-level code editing software (SublimeText3)
Hot Topics


 gate.io registration tutorial
Mar 31, 2025 pm 11:09 PM
gate.io registration tutorial
Mar 31, 2025 pm 11:09 PM
This article provides a detailed Gate.io registration tutorial, covering every step from accessing the official website to completing registration, including filling in registration information, verifying, reading user agreements, etc. The article also emphasizes security measures after successful registration, such as setting up secondary verification and completing real-name authentication, and gives tips from beginners to help users safely start their digital asset trading journey.
 okx Ouyi Exchange web version enter link click to enter
Mar 31, 2025 pm 06:21 PM
okx Ouyi Exchange web version enter link click to enter
Mar 31, 2025 pm 06:21 PM
1. Enter the web version of okx Euyi Exchange ☜☜☜☜☜☜ Click to save 2. Click the link of okx Euyi Exchange app ☜☜☜☜ Click to save 3. After entering the official website, the clear interface provides a login and registration portal. Users can choose to log in to an existing account or register a new account according to their own situation. Whether it is viewing real-time market conditions, conducting transactions, or managing assets, the OKX web version provides a simple and smooth operating experience, suitable for beginners and veterans. Visit OKX official website now for easy experience
 The latest registration tutorial for gate.io web version
Mar 31, 2025 pm 11:15 PM
The latest registration tutorial for gate.io web version
Mar 31, 2025 pm 11:15 PM
This article provides a detailed Gate.io web version latest registration tutorial to help users easily get started with digital asset trading. The tutorial covers every step from accessing the official website to completing registration, and emphasizes security settings after registration. The article also briefly introduces other trading platforms such as Binance, Ouyi and Sesame Open Door. It is recommended that users choose the right platform according to their own needs and pay attention to investment risks.
 ok official portal web version ok exchange official web version login portal
Mar 31, 2025 pm 06:24 PM
ok official portal web version ok exchange official web version login portal
Mar 31, 2025 pm 06:24 PM
This article details how to use the official web version of OK exchange to log in. Users only need to search for "OK Exchange Official Web Version" in their browser, click the login button in the upper right corner after entering the official website, and enter the user name and password to log in. Registered users can easily manage assets, conduct transactions, deposit and withdraw funds, etc. The official website interface is simple and easy to use, and provides complete customer service support to ensure that users have a smooth digital asset trading experience. What are you waiting for? Visit the official website of OK Exchange now to start your digital asset journey!
 Virtual currency trading platform app Ouyi download Virtual currency Ouyi trading APP Android download tutorial
Mar 31, 2025 pm 08:57 PM
Virtual currency trading platform app Ouyi download Virtual currency Ouyi trading APP Android download tutorial
Mar 31, 2025 pm 08:57 PM
This article introduces the basic information of Ouyi OKX trading platform and the installation steps of Android mobile client. Founded in 2017, Ouyi OKX is formerly OKEx, headquartered in Seychelles, providing coin trading, leveraged trading, options, delivery and perpetual contracts to tens of millions of users in more than 200 countries and regions around the world. The article elaborates on four steps from downloading the installation package to completing the installation, so that users can quickly get started with the OKX Android client. If you want to know the installation method of Ouyi OKX trading platform and Android client, please continue to read this article.
 gate.io latest registration tutorial for beginners
Mar 31, 2025 pm 11:12 PM
gate.io latest registration tutorial for beginners
Mar 31, 2025 pm 11:12 PM
This article provides newbies with detailed Gate.io registration tutorials, guiding them to gradually complete the registration process, including accessing the official website, filling in information, identity verification, etc., and emphasizes the security settings after registration. In addition, the article also mentioned other exchanges such as Binance, Ouyi and Sesame Open Door. It is recommended that novices choose the right platform according to their own needs, and remind readers that digital asset investment is risky and should invest rationally.
 Gate.io (Sesame Exchange) APP official download Gate.io official APP free download
Mar 31, 2025 pm 07:12 PM
Gate.io (Sesame Exchange) APP official download Gate.io official APP free download
Mar 31, 2025 pm 07:12 PM
This article details how to install the official Gate.io (Sesame Exchange) app on your phone. First, you need to download the installation package (.apk or .ipa file) from the official channel; Android users need to enable the "Unknown Source" installation permission; then click the installation package to install, and the application can be started after the installation is completed. Finally, register or log in to your account and start experiencing the trading, market viewing and other functions provided by Gate.io. Quickly master the installation steps of Gate.io App and easily start the digital asset trading journey!
 Top 10 of the formal Web3 trading platform APP rankings (authoritatively released in 2025)
Mar 31, 2025 pm 08:09 PM
Top 10 of the formal Web3 trading platform APP rankings (authoritatively released in 2025)
Mar 31, 2025 pm 08:09 PM
Based on market data and common evaluation criteria, this article lists the top ten formal Web3 trading platform APPs in 2025. The list covers well-known platforms such as Binance, OKX, Gate.io, Huobi (now known as HTX), Crypto.com, Coinbase, Kraken, Gemini, BitMEX and Bybit. These platforms have their own advantages in user scale, transaction volume, security, compliance, product innovation, etc. For example, Binance is known for its huge user base and rich product services, while Coinbase focuses on security and compliance. Choosing a suitable platform requires comprehensive consideration based on your own needs and risk tolerance.