Description: Use variables at points on a certain path to control follower points, construct trajectories, and use trajectories of a specific length to represent function graphs.
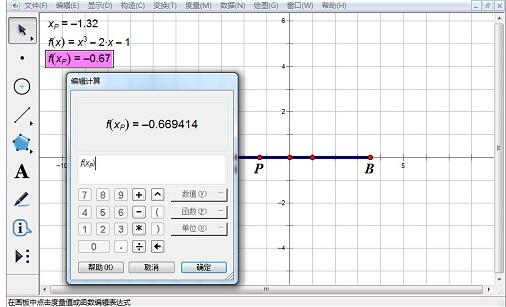
Create a coordinate system, use the point tool to construct two points A and B on the x-axis, and construct line segment AB. Select line segment AB, select [Construction] - [Point on Object], and construct point P on line segment AB. Measure the abscissa xp of point P.

2. Select [Data] - [New Function], in the [New Function] editor, edit the function [f(x)=x3-2x-1 ], click [OK]. Select [Data] - [Calculation], in the calculation editor, after clicking the function analytical expression f(x), click in the measurement value of the abscissa coordinate of P in the brackets. Get the value of the function with xp as the independent variable.

#3. Select the measurement value xp and the calculated value f(xp) in sequence, select [Drawing] - [Drawing Point], and you will get a drawing point Q.

#4. Select points P and Q, select [Construction] - [Trajectory], and you will get a trajectory. This trajectory is the function graph of the independent variable within the range AB. Change the position of A and B, and the size of the [image] will change accordingly.

The above is the detailed content of Related methods of customizing function size in Geometric Sketchpad. For more information, please follow other related articles on the PHP Chinese website!


