 Software Tutorial
 Computer Software
 How to draw the image of secant function using geometric sketchpad
How to draw the image of secant function using geometric sketchpad
Want to draw the graph of a secant function but don’t know where to start? PHP editor Youzi will provide you with detailed operation methods and guide you step by step to easily complete this task. Through this tutorial, you will master the steps required to plot the graph of a secant function and develop a deep understanding of its mathematical principles. Continue reading below to explore the power of Geometry Sketchpad and make graphing secant functions no longer a problem!
First understand the definition of secant function:
Suppose △ABC, ∠C=90°, AC=b, BC=a, AB=c,
positive Cut function: sec∠A=c/b (hypotenuse/adjacent side), y=secx.
In y=secx, take any value of x that makes secx meaningful and its corresponding y value as (x, y). The graph made in the rectangular coordinate system is called the image of the secant function, also called the secant curve.
The specific operations for drawing the secant function are as follows:
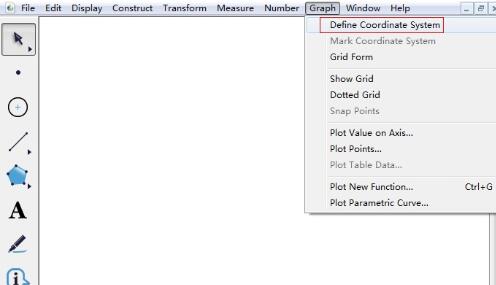
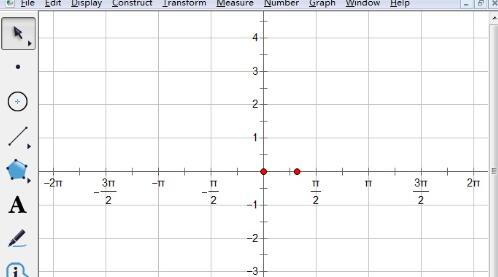
Open the geometric sketchpad, click the [Drawing] menu above, and select [Define Coordinate System] from the drop-down menu to establish the coordinate system. as the picture shows.

Since the secant function is also a trigonometric function, you need to change the coordinate unit to the trigonometric coordinate scale. Under the [Drawing] menu, select [Show Grid] - [Trigonometric Coordinate Axis] 】, thus changing the coordinates to the trigonometric coordinate system.

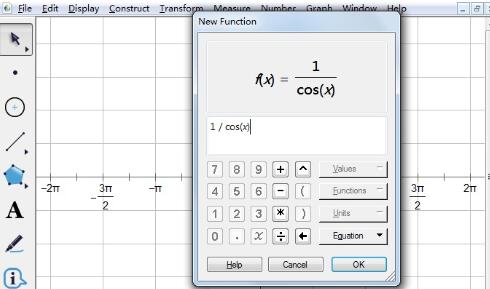
Click the [Draw] menu above, select [Draw New Function] in the drop-down menu, and enter [1], [÷], [cos], [x] in the pop-up function dialog box ], click [OK] after completing the input,

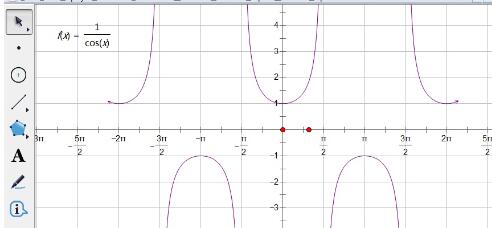
After inputting the function expression, the function f(x)=1/cos(x) appears in the upper left corner of the drawing board, and at the same time The graph of the secant function has also been drawn.

The above is the detailed content of How to draw the image of secant function using geometric sketchpad. For more information, please follow other related articles on the PHP Chinese website!

Hot AI Tools

Undresser.AI Undress
AI-powered app for creating realistic nude photos

AI Clothes Remover
Online AI tool for removing clothes from photos.

Undress AI Tool
Undress images for free

Clothoff.io
AI clothes remover

Video Face Swap
Swap faces in any video effortlessly with our completely free AI face swap tool!

Hot Article

Hot Tools

Notepad++7.3.1
Easy-to-use and free code editor

SublimeText3 Chinese version
Chinese version, very easy to use

Zend Studio 13.0.1
Powerful PHP integrated development environment

Dreamweaver CS6
Visual web development tools

SublimeText3 Mac version
God-level code editing software (SublimeText3)

Hot Topics
 1657
1657
 14
14
 1415
1415
 52
52
 1309
1309
 25
25
 1257
1257
 29
29
 1230
1230
 24
24
 How much does Microsoft PowerToys cost?
Apr 09, 2025 am 12:03 AM
Microsoft PowerToys is free. This collection of tools developed by Microsoft is designed to enhance Windows system functions and improve user productivity. By installing and using features such as FancyZones, users can customize window layouts and optimize workflows.
 What is the best alternative to PowerToys?
Apr 08, 2025 am 12:17 AM
ThebestalternativestoPowerToysforWindowsusersareAutoHotkey,WindowGrid,andWinaeroTweaker.1)AutoHotkeyoffersextensivescriptingforautomation.2)WindowGridprovidesintuitivegrid-basedwindowmanagement.3)WinaeroTweakerallowsdeepcustomizationofWindowssettings
 Does Microsoft PowerToys require a license?
Apr 07, 2025 am 12:04 AM
Microsoft PowerToys does not require a license and is a free open source software. 1.PowerToys provides a variety of tools, such as FancyZones for window management, PowerRename for batch renaming, and ColorPicker for color selection. 2. Users can enable or disable these tools according to their needs to improve work efficiency.
 Is Microsoft PowerToys free or paid?
Apr 06, 2025 am 12:14 AM
Microsoft PowerToys is completely free. This tool set provides open source utilities that enhance Windows operating system, including features such as FancyZones, PowerRename, and KeyboardManager, to help users improve productivity and customize their operating experience.
 Is PowerToys part of Windows 11?
Apr 05, 2025 am 12:03 AM
PowerToys is not the default component of Windows 11, but a set of tools developed by Microsoft that needs to be downloaded separately. 1) It provides features such as FancyZones and Awake to improve user productivity. 2) Pay attention to possible software conflicts and performance impacts when using them. 3) It is recommended to selectively enable the tool and periodically update it to optimize performance.


