Want to create a highly intuitive column chart to display data? WPS forms provide you with a convenient solution. PHP editor Yuzai will introduce in detail the method of making column charts using WPS to help you easily master chart drawing and make the data presentation more intuitive and convincing.
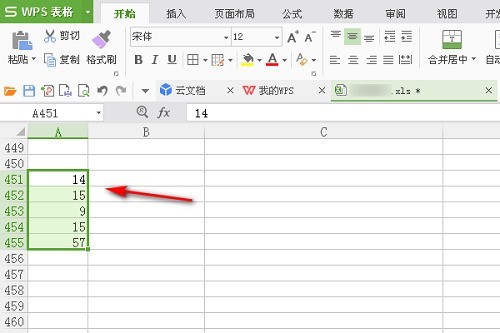
1. First open the WPS form and select the data, as shown in the figure below.

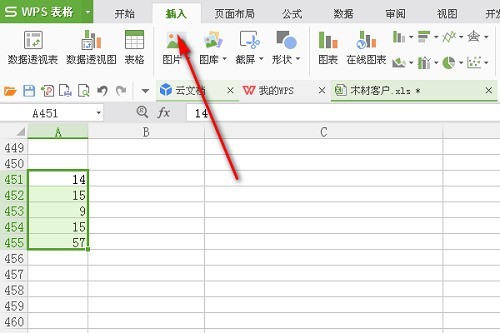
2. Then click [Insert] in the task tab above, as shown in the figure below.

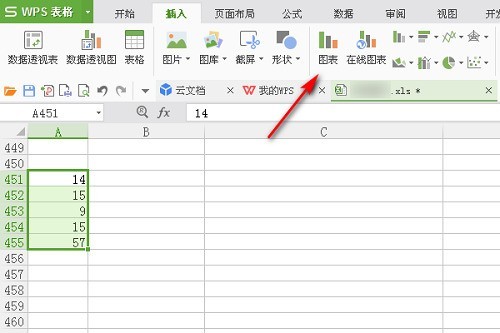
3. Then click [Chart] to insert a chart, as shown in the figure below.

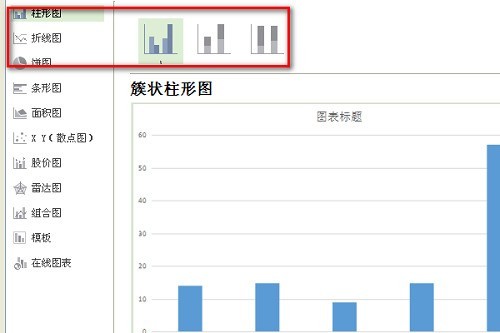
4. Finally, you can see the histogram. Select a style to add it, as shown in the figure below.

The above is the detailed content of How to make a bar chart with WPS_How to make a bar chart with WPS. For more information, please follow other related articles on the PHP Chinese website!
 How to turn off win10 upgrade prompt
 The difference between lightweight application servers and cloud servers
 CMD close port command
 The difference between external screen and internal screen broken
 How to jump with parameters in vue.js
 Cell sum
 How to intercept harassing calls
 virtual digital currency


