Photoshop简单制作螺旋图形效果
这篇教程是向脚本之家的朋友分享Photoshop简单制作螺旋图形效果方法,教程比较基础,适合新手来学习,推荐到脚本之家,喜欢的朋友可以参考本文,来看看吧
今天为大家分享Photoshop简单制作螺旋图形效果方法,教程比较基础,制作出来的效果非常漂亮,推荐过来,希望能对大家有所帮助!
1、在ps软件中,新建一个800*800的文档,背景色为填充深灰色,再选择椭圆选框工具,羽化像素为45,如图所示
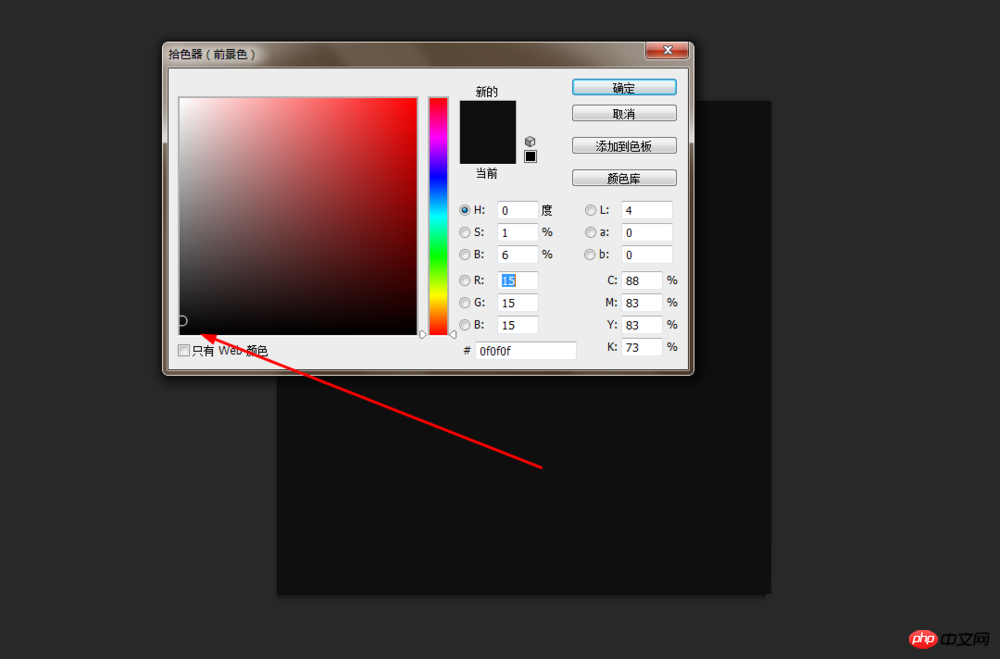
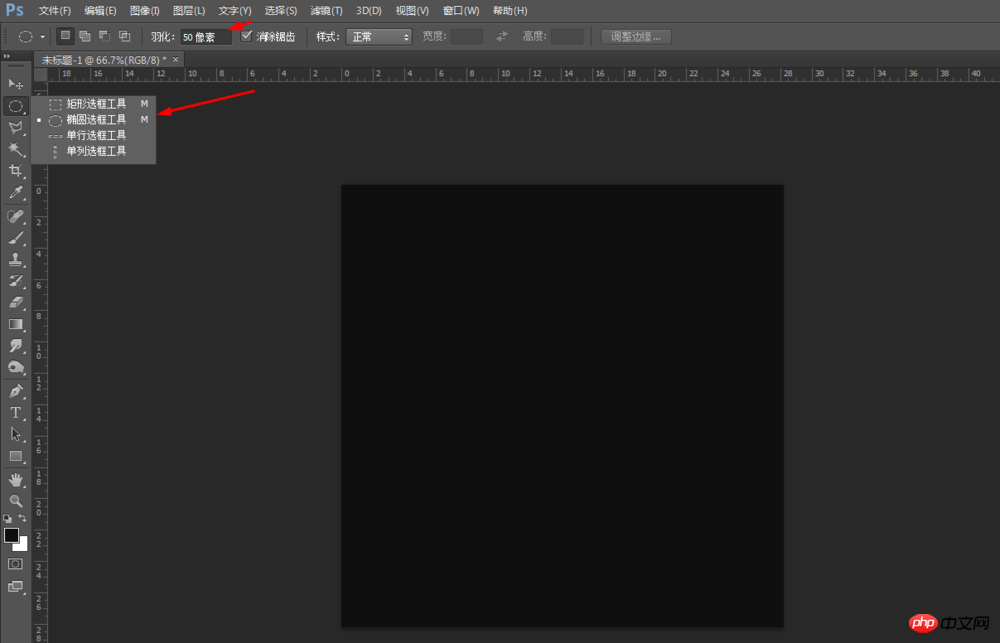
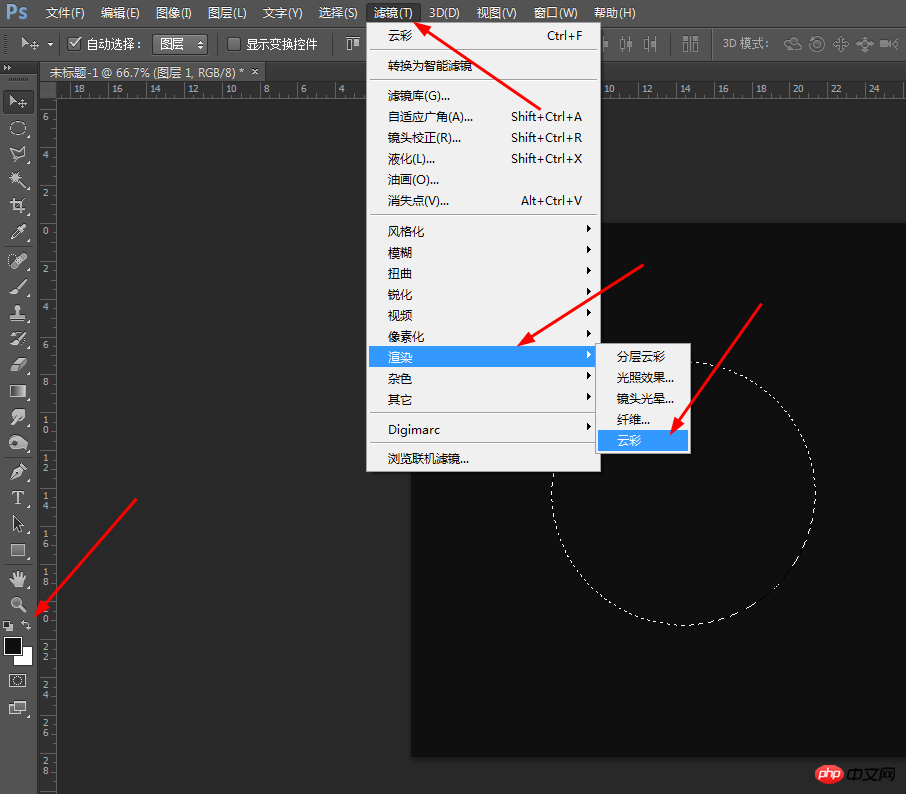
2、然后画一个正圆选区,前背景色为黑白,在滤镜中添加云彩,如图所示
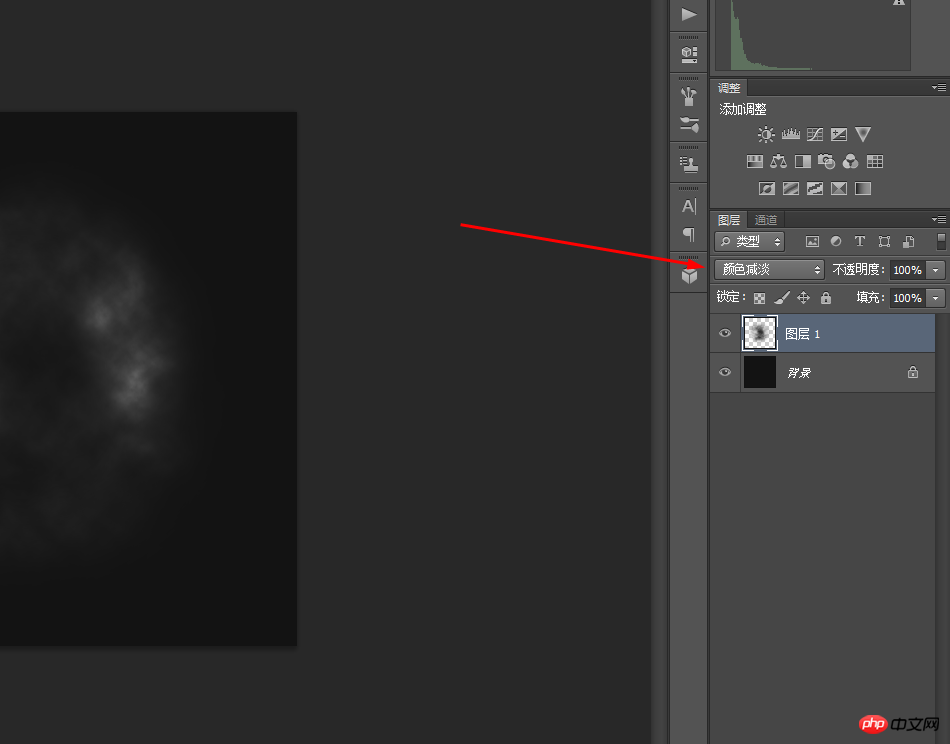
3、接着把图层的模式改为线性减淡,如图所示
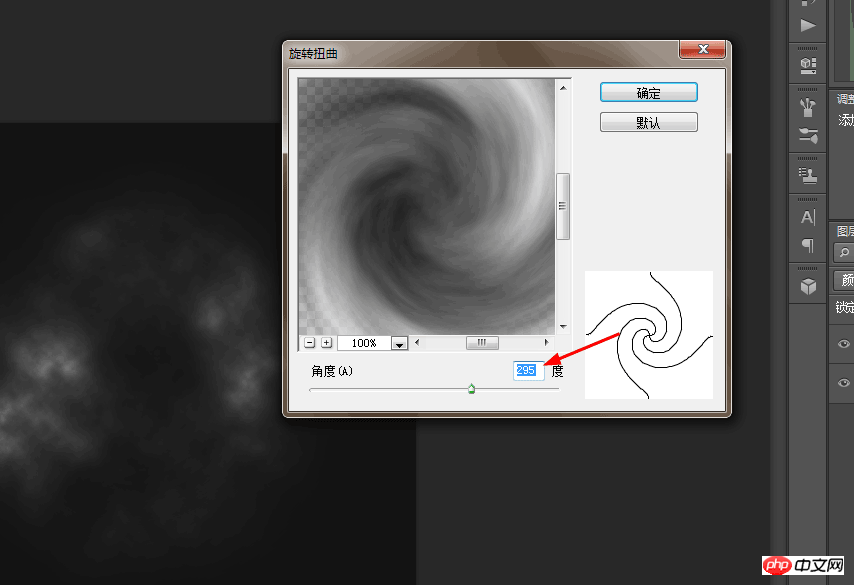
4、接着选择图层1,在滤镜中添加旋转扭曲,如图所示
5、然后把图层1复制一个出来,然后按ctrl+T,旋转15度角,如图所示

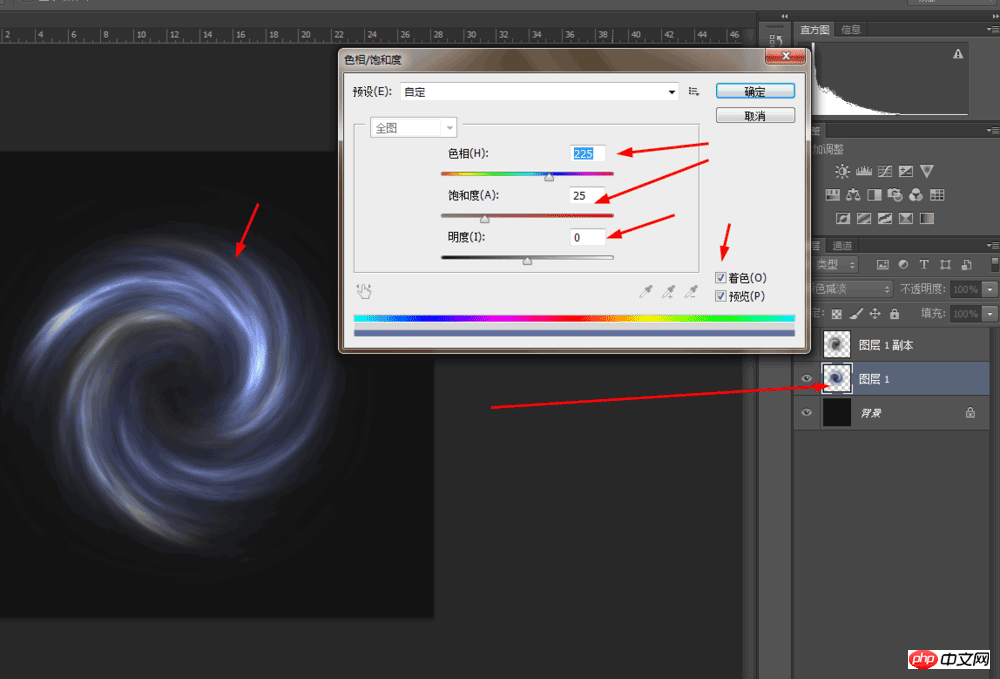
6、选图层1,按ctrl+u调一下色相饱和度,如图所示
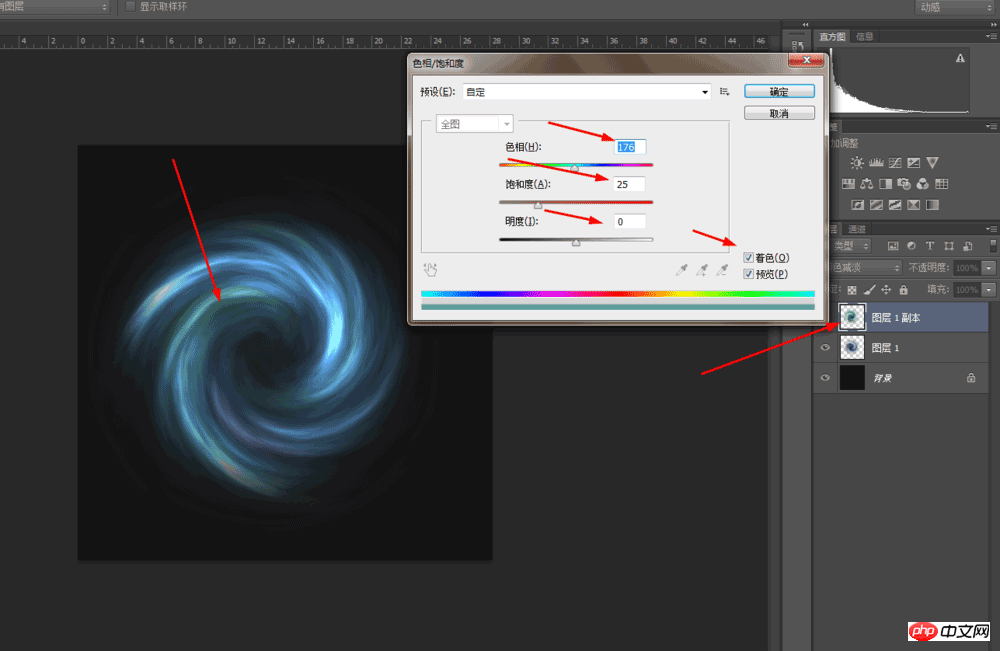
7、再接着选择图层1的副本,再按ctrl+u调一下色相饱和度,如图所示
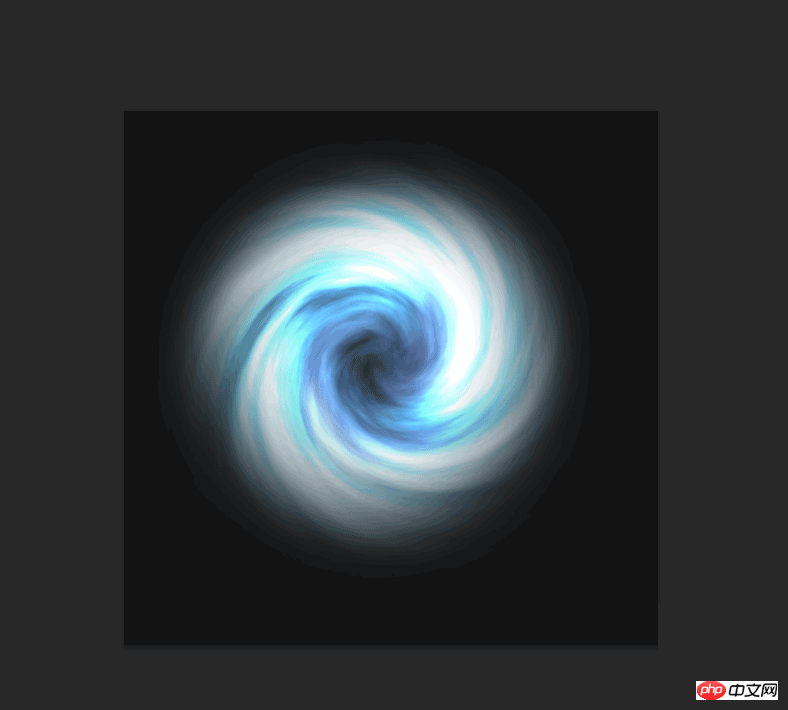
8、最后合并两个图层,如图所示
以上就是Photoshop简单制作螺旋图形效果方法介绍,操作很简单的,大家学会了吗?希望能对大家有所帮助!

Hot AI Tools

Undresser.AI Undress
AI-powered app for creating realistic nude photos

AI Clothes Remover
Online AI tool for removing clothes from photos.

Undress AI Tool
Undress images for free

Clothoff.io
AI clothes remover

AI Hentai Generator
Generate AI Hentai for free.

Hot Article

Hot Tools

Notepad++7.3.1
Easy-to-use and free code editor

SublimeText3 Chinese version
Chinese version, very easy to use

Zend Studio 13.0.1
Powerful PHP integrated development environment

Dreamweaver CS6
Visual web development tools

SublimeText3 Mac version
God-level code editing software (SublimeText3)

Hot Topics
 Apple M3 Ultra launches new version, adding 32 CPU cores and 80 GPU cores
Nov 13, 2023 pm 11:13 PM
This chip may be equipped with up to 80 GPU cores, making it the most powerful product in the M3 series. Max has twice the number of cores. Judging from the development model of the M1 and M2 series, Apple's "Ultra" version of the chip basically has twice the number of cores of the "Max" version. This is because Apple actually uses two Max chips internally. The connection technologies are combined to form M1Ultra and M2Ultra. 80 GPU cores M3Ultra may have "up to 80 graphics processing cores." This prediction is based on the development path of Apple's chips: from the basic version to the "Pro" version, to the "Max" version with twice the number of graphics cores, and the "Ultra" version with double the number of CPU and GPU cores. For example
 AMD graphics card performance ranking in 2020
Jan 13, 2024 pm 08:54 PM
amd graphics card ranking 1. What needs to be rewritten for Radeon is: RX. What needs to be rewritten for Radeon is: 6950XT2. What needs to be rewritten for Radeon is: RX. What needs to be rewritten is: 6900XT. 3. Radeon What needs to be rewritten is: RX What needs to be rewritten is: 6800XT4, Radeon What needs to be rewritten is: RX What needs to be rewritten is: 6800 What needs to be rewritten is: 5. Radeon needs to be rewritten: What needs to be rewritten for RX is: 6750XT6, what needs to be rewritten for Radeon is: what needs to be rewritten for RX is: 6700XT7
 How to combine two graphics in PPT
Mar 20, 2024 pm 05:00 PM
Hello everyone, today I will share with my friends the specific steps of how to combine two graphics in PPT. If you follow these steps, you will learn the operation step by step, and you can draw inferences in the future. The details of the steps are below. Friends, come and take a serious look! 1. First, open a PPT document on your computer, and then create a new PPT slide (as shown in the picture below). 2. Next, find [Shape] in the upper menu bar item [Insert], and select the shape to be imported in the drop-down box of the shape (as shown in the red circle in the figure below). 3. Use the insert function of PPT to insert the triangle and circle shapes into the PPT in sequence, and adjust the size and position of the shapes (as shown by the red arrow in the picture below). 4
 CSS drawing: how to achieve a simple gradient graphic effect
Nov 21, 2023 pm 04:51 PM
CSS Drawing: Implementing Simple Gradient Graphic Effects In web design, gradient graphic effects are a common visual element that can add an attractive look and experience to a website. In CSS, we can use gradient effects to easily achieve gradient effects on various graphics, including rectangles, circles, text, etc. This article will introduce how to use CSS to achieve a simple gradient graphic effect, and provide specific code examples. 1. Linear gradient Linear gradient refers to the effect of gradual change from one point to another point. In CSS we can use l
 The symphony of data visualization: composing it in Python
Mar 09, 2024 am 10:04 AM
Data visualization has become an integral part of modern data analysis. It transforms complex data sets into easy-to-understand graphs and charts, helping us spot trends, recognize patterns, and make informed decisions. As a powerful programming language, python provides a wealth of libraries and toolkits that allow you to easily create various data visualizations. To start your visualization journey, you need to import the necessary Python libraries. The two most popular libraries are Matplotlib and Seaborn. Matplotlib is a low-level plotting library that gives you fine control over the appearance of your chart, while Seaborn is a high-level library that provides an intuitive and beautiful API. Import library importmatplotl
 How do C++ libraries handle graphics and interfaces?
Apr 18, 2024 pm 06:03 PM
The C++ function library provides a variety of graphics and interface processing tools, including: SFML (cross-platform 2D graphics and audio library): used to develop sprite-driven 2D games and media players. Qt (cross-platform graphical user interface framework): used for developing desktop applications and media players.
 How to represent graph using correlation matrix in Java?
Sep 18, 2023 am 11:17 AM
In order to represent a graph in Java using an association matrix, a data structure must be built that contains the relationships between vertices and edges. An association matrix is a two-dimensional array in which the rows and columns represent vertices and edges respectively, and the entries represent the connections between them. If there is "1" at position (i, j), then vertex i intersects edge j. Although more memory may be required for large graphs, this approach allows efficient graph operations such as inserting or deleting edges. By creating this data structure in Java, programmers can efficiently build and manipulate graph structures to solve many problems in computer science and related fields. Correlation Matrix In graph theory, the relationship between vertices and edges in a graph is mathematically represented by an correlation matrix. The correlation matrix is a two-dimensional binary matrix,
 How to combine PPT graphics into love text effect
Mar 26, 2024 pm 04:20 PM
1. Open PPT and create a new blank page after opening the software. 2. After creating a new blank page, click Insert Select Shape at the top, and first select the L-shaped insertion shape. 3. After inserting the L-shaped shape, select the oval shape and press the shift key to change the shape from an ellipse to a perfect circle. Then we set the fill color of the ellipse to orange. 4. Use process symbols to design the shape of v. After selecting the symbol, rotate it to create a v effect. We can fill the v graphic with red. 5. Use the L-shaped shape and apply it to combine the letters e. 6. Select the 4 shapes we inserted, click Distribute horizontally, and distribute them neatly and evenly. 7. Finally, select all the shapes, right-click and select Group, so that all


