

For example: nmon -f -s 1.
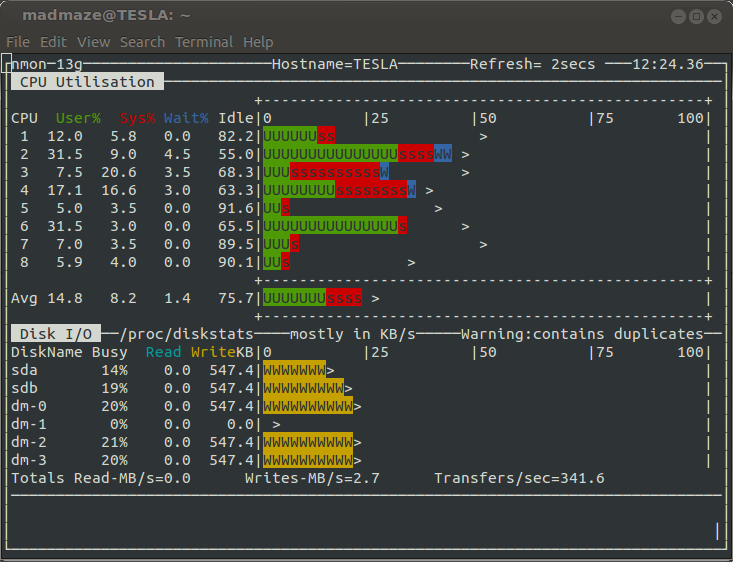
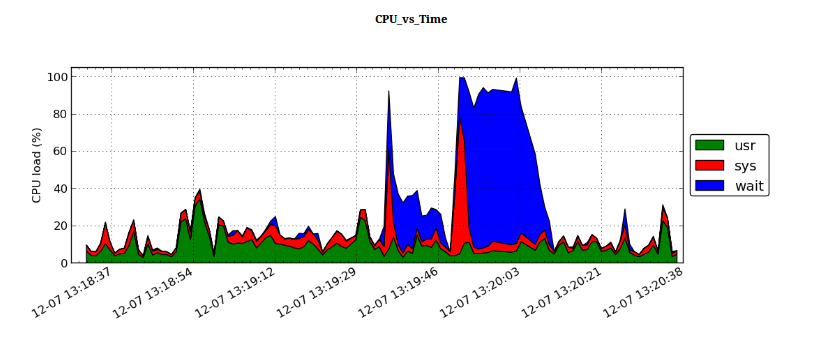
nmon CPU and Disk utilization
A log file will be created. The beginning of the log file is some system metadata (AAA - BBBV part), followed by regular snapshots of the monitored system properties, such as CPU and memory usage. This output file is difficult to process directly by a spreadsheet application, so the Nmon_Analyzer excel macro was born. This tool is great if you are using Windows/Mac and have Microsoft Office installed. If you don't have this environment, you can also use the Nmon2rrd tool. This tool can convert log files into RRD input files and then generate graphics. The process is rigid and a bit cumbersome. Now a more flexible tool has emerged, and I introduce to you pyNmonAnalyzer, which provides a customizable solution to generate structured CSV files and simple HTML reports with images generated with matplotlib.
system requirement:
It can be seen from the name that we need python. In addition, pyNmonAnalyzer also depends on matplotlib and numpy. If you are using a debian-derived system, you need to install these packages first:
$ sudo apt-get install python-numpy python-matplotlib
You can clone the git repository:
$ git clone git@github.com:madmaze/pyNmonAnalyzer.git
Or, download directly from here: pyNmonAnalyzer-1.0.zip. (LCTT translation annotation: This was a project 5 years ago but it has been continuously maintained)
Next we need an Nmon file. If not, you can use the instance provided in the distribution or record a sample yourself: nmon -F test.nmon -s 1 -c 120, which will record 120 snapshots per second. One, stored in the test.nmon file.
Let’s take a look at the basic help information:
$ ./pyNmonAnalyzer.py -h
usage: pyNmonAnalyzer.py [-h] [-x] [-d] [-o OUTDIR] [-c] [-b] [-r CONFFNAME]
 input_file
nmonParser converts Nmon monitor files into time-sorted
CSV/Spreadsheets for easier analysis, without the use of the
MS Excel Macro. Also included is an option to build an HTML
report with graphs, which is configured through report.config.
positional arguments:
 input_file Input NMON file
optional arguments:
 -h, --help show this help message and exit
 -x, --overwrite overwrite existing results (Default: False)
 -d, --debug debug? (Default: False)
 -o OUTDIR, --output OUTDIR
 Output dir for CSV (Default: ./data/)
 -c, --csv CSV output? (Default: False)
 -b, --buildReport report output? (Default: False)
 -r CONFFNAME, --reportConfig CONFFNAME
 Report config file, if none exists: we will write the
 default config file out (Default: ./report.config)
This tool has two main options
The following command will generate both a CSV file and an HTML report:
$ ./pyNmonAnalyzer.py -c -b test.nmon
This will create a ./data directory, which contains a directory for CSV files (./data/csv/), a directory for PNG images (./data/img/) and an HTML report (./ data/report.html).
By default, images are used in the HTML report to display CPU, disk busyness, memory usage, and network transmission. All of this is defined in a self-explanatory configuration file (report.config). At present, this tool is not particularly flexible, because CPU and MEM cannot be configured other than on and off. However, the next step will be to improve the plotting method and allow users to flexibly specify which plotting method to use for which data.
Currently these reports are very boring and can only print out several basic mark charts, but its functions are still being improved. Currently under development is a wizard to make configuration adjustments easier. If you have any suggestions, find any bugs, or have any feature requests, please feel free to contact me.
The above is the detailed content of Artifact Nmon. For more information, please follow other related articles on the PHP Chinese website!


![[Web front-end] Node.js quick start](https://img.php.cn/upload/course/000/000/067/662b5d34ba7c0227.png)


