How to implement line chart with jQuery_jquery
May 16, 2016 pm 04:11 PMThe example in this article describes how to implement a line chart with jQuery. Share it with everyone for your reference. The details are as follows:
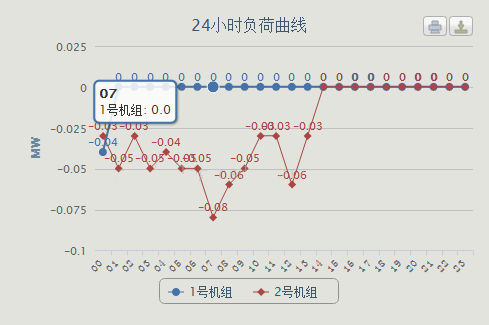
The rendering is as follows:

js reference:
<script src="js/Index/raphael.2.1.0.min.js" type="text/javascript"></script>
<script src="js/Index/justgage.1.0.1.js" type="text/javascript"></script>
<script src="Js/Index/highcharts.js" type="text/javascript"></script>
<script src="Js/Index/exporting.js" type="text/javascript"></script>
Refresh regularly:
ar chart;
$(document).ready(function() {
chart = new Highcharts.Chart({
chart: {
Renderto: 'Divchart', // Place the container of the chart
plotBackgroundColor: null,
plotBorderWidth: null,
defaultSeriesType: 'line'
},
title: {
text: '24-hour load curve'
},
subtitle: { text: ''
},
xAxis: {//X-axis data
categories: ['00','01', '02','03', '04','05', '06','07', '08','09', '10','11' , '12','13', '14','15', '16','17', '18','19', '20','21', '22','23'],
labels: {
rotation: -45, //Font tilt
align: 'right',
style: { font: 'normal 12px 宋体' }
},
yAxis: {//Y-axis display text
title: {
text: 'MW' },
tooltip: {
enabled: true, Formatter: function() {
return '<b>' this.x '</b><br/>' this.series.name ': ' Highcharts.numberFormat(this.y, 1);
},
plotOptions: {
Line: {
dataLabels: {
enabled: true EnableMouSetracking: True // Whether Title
},
series: [{
name: 'Unit 1',
data: [0,0,0,0,0,0,0,0,0,0,0,0,0,0,0,0,0,0,0,0,0,0,0,0 ]
},{
name: 'Unit 2',
data: [0,0,0,0,0,0,0,0,0,0,0,0,0,0,0,0,0,0,0,0,0,0,0,0 ]
}]
});
function getForm(){
$.ajax({
type: "POST", //要用post方式
url: "WebServiceFH.asmx/GetLoadEveryHourByOne",
contentType: "application/json",
data: {},
dataType: "json",
success: function (data) {
var data = [data["Load0"],data["Load1"],data["Load2"],data["Load3"],data["Load4"],data["Load5"],data["Load6"],data["Load7"],data["Load8"],data["Load9"],data["Load10"],data["Load11"],data["Load12"],data["Load13"],data["Load14"],data["Load15"],data["Load16"],data["Load17"],data["Load18"],data["Load19"],data["Load20"],data["Load21"],data["Load22"],data["Load23"]];
chart.series[0].setData(data);
},
error: function (err) {
alert("读取数据出错!");
}
});
$.ajax({
type: "POST", //要用post方式
url: "WebServiceFH.asmx/GetLoadEveryHourByTwo",
contentType: "application/json",
dataType: "json",
success: function (data) {
var data = [data["Load0"],data["Load1"],data["Load2"],data["Load3"],data["Load4"],data["Load5"],data["Load6"],data["Load7"],data["Load8"],data["Load9"],data["Load10"],data["Load11"],data["Load12"],data["Load13"],data["Load14"],data["Load15"],data["Load16"],data["Load17"],data["Load18"],data["Load19"],data["Load20"],data["Load21"],data["Load22"],data["Load23"]];
chart.series[1].setData(data);
},
error: function (err) {
alert("读取数据出错!");
}
});
}
$(document).ready(function() {
// Automatically call the method every 3 seconds to realize real-time update of the chart
getForm(); window.setInterval(getForm,600000); });
});

Hot Article

Hot tools Tags

Hot Article

Hot Article Tags

Notepad++7.3.1
Easy-to-use and free code editor

SublimeText3 Chinese version
Chinese version, very easy to use

Zend Studio 13.0.1
Powerful PHP integrated development environment

Dreamweaver CS6
Visual web development tools

SublimeText3 Mac version
God-level code editing software (SublimeText3)

Hot Topics
 How to write a novel in the Tomato Free Novel app. Share the tutorial on how to write a novel in Tomato Novel.
Mar 28, 2024 pm 12:50 PM
How to write a novel in the Tomato Free Novel app. Share the tutorial on how to write a novel in Tomato Novel.
 How to delete WeChat friends? How to delete WeChat friends
Mar 04, 2024 am 11:10 AM
How to delete WeChat friends? How to delete WeChat friends
 How to enter bios on Colorful motherboard? Teach you two methods
Mar 13, 2024 pm 06:01 PM
How to enter bios on Colorful motherboard? Teach you two methods
 How to recover deleted contacts on WeChat (simple tutorial tells you how to recover deleted contacts)
May 01, 2024 pm 12:01 PM
How to recover deleted contacts on WeChat (simple tutorial tells you how to recover deleted contacts)
 Summary of methods to obtain administrator rights in Win11
Mar 09, 2024 am 08:45 AM
Summary of methods to obtain administrator rights in Win11
 Quickly master: How to open two WeChat accounts on Huawei mobile phones revealed!
Mar 23, 2024 am 10:42 AM
Quickly master: How to open two WeChat accounts on Huawei mobile phones revealed!
 Detailed explanation of Oracle version query method
Mar 07, 2024 pm 09:21 PM
Detailed explanation of Oracle version query method
 The secret of hatching mobile dragon eggs is revealed (step by step to teach you how to successfully hatch mobile dragon eggs)
May 04, 2024 pm 06:01 PM
The secret of hatching mobile dragon eggs is revealed (step by step to teach you how to successfully hatch mobile dragon eggs)


